Back | Forward | Close this Window
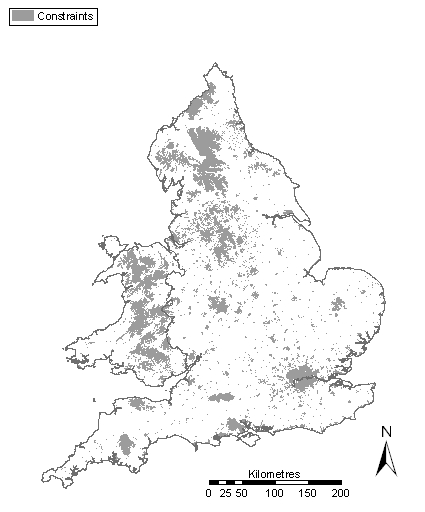
Figure 2: Constraints base map, showing urban areas, forests, lakes, and danger zones (derived from Bartholomew GB2003 dataset)