Back | Forward | Close this Window
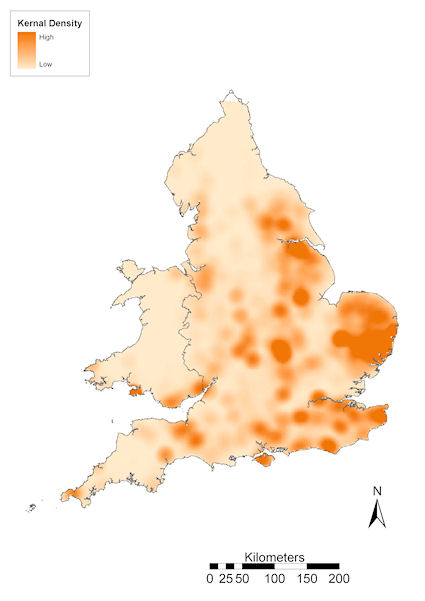
Figure 5: Overall distribution of all PAS finds presented as kernel density plot