Back | Forward | Close Window
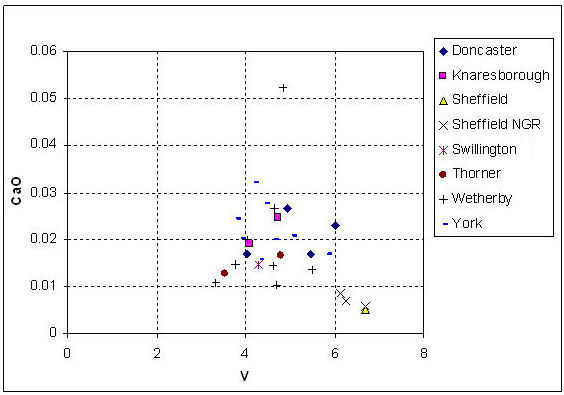
Figure 28: Normalised data for York Gritty ware: plot of Vanadium against Calcium values