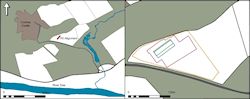
Figure 6: Location of the pit alignment and geophysical survey grids (left). Electromagnetic induction survey in orange, magnetometry in red, earth resistance in blue and ground penetrating radar in green.
The date of the Warren Field alignment, the arrangement of the pits and the larger archaeological context of the region are of considerable interest. There is evidence that Neolithic societies in north-east Scotland had the capacity to create monuments associated with astronomical alignments and also that at least one later monument type found in the region, the recumbent stone circle, appears to have a consistent association with the position of the full moon at midsummer (Ruggles 1999, 91-9; 2005, 361-4), even if they are no longer thought to have demarcated open spaces but rather to have been built to enclose cairns (Welfare 2012; Ruggles in press b). The idea that hunter-gather communities may have drawn on celestial symbolism in the creation of the monumental line of pits at Warren Field certainly encouraged an earlier study of the alignment's use for astronomic purposes (Murray et al. 2009, 22; Smith and Higginbottom 2007).
In reviewing the evidence, the current authors noted the distinctive arc and the clear sequence of pit sizes, which peak at the centre and features 5 and 7. It was also noted that the depths of the excavated pits appeared to follow the trend of the surface area of the features in a deliberate manner. The excavated pits showed signs of periodic re-cutting over an extensive period of the Mesolithic and, indeed, data from six of the eight excavated pits indicated that the ultimate phases of the pits were during the Neolithic period, some four thousand years after the original construction of the monument and, tentatively, suggested activity associated with the nearby Neolithic timber hall. The fills of the pits were also of considerable interest as most of the larger features appeared to be associated with deposition of burnt material and some with exotic lithic material, presumably as a deliberate act. Pit 5 probably held a post or stake at some point in its development and pit 6 provided evidence for the burnt base of a stake.
Figure 6: Location of the pit alignment and geophysical survey grids (left). Electromagnetic induction survey in orange, magnetometry in red, earth resistance in blue and ground penetrating radar in green.
The unique nature of the monument, and the fact that four of the pits had not been excavated during the original excavation, suggested that a geophysical survey should be carried out to clarify and confirm the structure and nature of the unexcavated features associated with the pit alignment and to ascertain whether there were further features connected to the alignment or whether any related features could be identified within the surrounding area (Figure 6). A survey was carried out over two days in February 2013 with teams from the Universities of Bradford, St Andrews and Birmingham. This included electromagnetic induction survey (1.5ha), ground-penetrating radar (0.1ha), magnetometry (0.7ha), earth resistance (0.18ha) and electrical resistivity tomography survey (5 profiles). The results of the work were variable. The geology of the site provided the primary response to electromagnetic survey with only several broad features being identified through this extensive work. There were significant land management issues relating to the interpretation of the magnetometry data. The presence of a scatter of ferrous material to the east of the site and disturbance to the north and west of the site, probably resulting from cattle congregating near the field entrance, prevented identification of any other significant features in these areas. However, targets that could be associated with the excavated pits were identified within the remaining surveys and these were particularly clear within the ground-penetrating radar and electrical resistivity tomography surveys (Figures 7-9). These detailed surveys essentially confirm the nature of the alignment and support the proposition of the excavators that some of the four unexcavated features may have been slightly larger than mapped. The 3D volume data, however, suggest that the mapped features still follow the general trends of feature size identified for the monument overall and there were no certain additions to the monument.
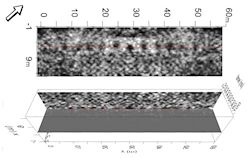
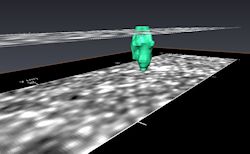
Figure 7: GPR results with pits corresponding to the excavated and unexcavated features mapped during excavation.
Figure 8: Solid model of pit 9 located within the GPR survey. The results appear to confirm the suspicion of the excavators that the very dry conditions may have meant that some of the unexcavated pits were originally wider than planned. It should be noted that the depth of the solid model of pit 9 is exaggerated by the perspective of the image and the presence of a large anomaly, possibly a stone, in or near the pit.
Figure 9: Animation of Electrical Resistivity Tomography (ERT) using the FlashRes64 instrument which is a multi-channel, free-configuration system. The data cube comprises five inverted sections using an inter-probe separation of 0.5m. The location of the survey was based on an initial Twin-Probe area survey which indicated the position of some of the pits. The ERT data are characterised by a relatively low resistivity topsoil layer followed by an extremely high value band about 1m thick. Below this band the values are more modest. Significantly, where the pits had been predicted by the Twin-Probe array the ERT suggests that the highly resistive layer has been cut by pits of significant size. These can be seen within the cube and the animated height field display.
Structurally the alignment of the pits directed the next phase of research. The features peaked in size towards the centre and appear to frame pit 6, which is clearly offset between the two largest pits. This suggested to the team that any alignment was not likely to be along the length of the structure but perpendicular to the length and probably through pit 6. As views to the north were blocked by a gentle slope, the most obvious orientation of the monument was to the south-east and towards the pass associated with the 'Slug Road' framed on the southern horizon between the low hills of Cairn-Mon-Earn and Craigberg (Figure 10). This was important as, at around 8000 BC, this small pass framed the rising of the midwinter sun at the solstice. Visually, the larger pits also appeared to flank pit 6 in reflection of the topography of the southern horizon.
These observations were investigated through a series of specially written software applications that permitted an interactive exploration of the relationship between the pits at Warren Field, the wider landscape and astronomical phenomena. The 'Pitview' model used simple geometry to incorporate the locations of the pits as well as the location and viewing direction of an observer (Figure 11). The backdrop to the view was the horizon, as calculated from Ordnance Survey terrain data. Beyond the horizon the application could display the paths of the sun on any day of the year and the lunar limits. In performing these astronomical calculations full account was taken of the variation in the obliquity of the ecliptic, which causes solar and lunar phenomena to change over time periods of thousands of years. For example, at the latitude of Warren Field the midwinter solstice sunrise is currently two degrees of azimuth further north than it was in the Mesolithic. The results of this work emphasised the previous observations of the relationship of the pits to the mid-winter sunrise and the prominent cleft in the horizon associated with the Slug Road Pass.
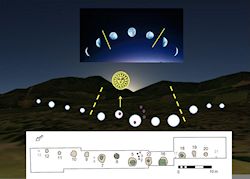
Figure 10: The plan of the Warren Field pit alignment below the symbolic arrangement of the pits in relation to the Slug Road pass. Green indicates a later recut and greyed features are of uncertain character. The backdrop has been exaggerated for display purposes (© Google Earth, Plan based on Murray et al. 2009, fig. 3).
Figure 11: Animation of the 'Pitview' application showing the position of the rising sun in relation to local topography and viewed from the Warren Field pit alignment between December 8001 BC and December 8000 BC. Grey lines indicate pits and the relative size of the features is indicated by a triangle on the lower section of the line. Black lines indicate other features.
The alignment of the pits towards the midwinter sun is therefore interesting but this cannot be seen as a comprehensive explanation of the monument or its structure. For example, the intriguing arcing configuration of the pits noted was clearly a deliberate feature of the alignment. Thus although archaeoastronomers studying Neolithic stone alignments in Scotland have tended to focus on the orientation along their length (see Ruggles 1999, chapters 6 and 7), it is difficult to plot an exact alignment across the long axis of the Warren Field pit group. In fact, the approximate orientation along its length suggests that there may be a visual link with the setting moon at its southern minor standstill limit and the rising moon at the northern minor standstill limit (Figures 12 and 13 and Appendix). This, however, may be a coincidental, geometrical effect resulting from aligning a structure roughly perpendicularly to the direction of midwinter sunrise. Furthermore, the minor standstill limits (as opposed to the major standstill limits) do not represent the extreme rising or setting points of the moon along the horizon, and it is difficult to conceive why and how people would have constructed precise alignments upon them even if they were aware of the 18.6-year lunar node cycle (González in press).
On the other hand, luni-solar calendars are ubiquitous in the ethnographic record (Nilsson 1920, chapters 5 and 6). In societies that were at least semi-sedentary, a simple way to identify the need for a seasonal correction is by watching for the sun to rise or set behind a significant topographic feature as observed from a particular location. Could the pit group encapsulate or represent lunar observations in some way, with the solar alignment providing an annual recalibration? One possibility is that the pit alignment was developed over time to mirror the phases of the moon, passing from one to the next along the alignment. Their relative sizes, and distinctive shape, are highly suggestive of the lunar phases, passing from waxing to gibbous and full and then back through the waning sequence. Visually, the monument does seem to discriminate between three sequences reflecting the moon – waxing/gibbous-full/waning - and this may suggest use as part of a tripartite or decadal system in which the month is divided into roughly ten days (Figure 10). Although bipartite divisions are more common historically, tripartite schemes are attested in the ethnographic record of time keeping (Webster 1916, 188). The slight lack of symmetry in the arrangement is interesting and it may be that there is some variation in the monument that reflects other factors or that the final decade is shorter than the others to represent the actual length of the lunar month (Nilsson 1920, 167-8).
This is not to imply that the pits 'literally' encapsulate an observed sequence of moonrises. There are many reasons for dismissing this idea, not least that during most or all of the waxing phase moonrise occurs during daytime and could not be seen. Furthermore, a particular sequence of moonrises could only be observed during a period of fine weather, and would not be repeated in the same positions at all often, owing to the complex interactions of the phase, seasonal, and node cycles (see Appendix). The monument may represent a composite of observations related to the moon and therefore a symbolic representation of how the observers saw the lunar cycle overall rather than a direct representation of any specific lunar month.
However, one other consideration suggests that the structure, developed over a significant time, may eventually have possessed more than merely symbolic value and that it could have acquired basic calendrical functions through observation of the repeated cycles of the moon. This is due to the fact that there are at least 12 pits, and there being 12 or 13 synodic months in a seasonal year. If the pits were used as a tally system, with a marker used to indicate the 'current' month, then the 12 divisions within the structure could have acted as a basic 'time reckoner', with each pit linked to a lunar month. Perhaps one pit, number 6, was set apart, or also used, for observation of sunrise on or around midwinter solstice so as to ensure a continuing seasonal fit via an annual solar recalibration of the sequence. If this is correct, the simplicity of the Warren Field structure is such that an observer would be able to track time throughout the year and, once a year, correct the sequence for seasonal shift. This suggestion remains hypothetical at this time, but it is interesting to note that two of the central pits at least, 5 and 6, had post or stake settings within them which may indicate markers for such a purpose.
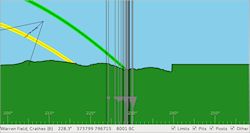
Figure 12: View along the pit alignment toward the south-west and the lunar minor limit. The lunar minor limit is coloured in green and the path of the sun is yellow. Grey lines indicate pits and the relative size of the features is indicated by a triangle on the lower section of the line. Black lines indicate other features. Insert top left indicates the viewing position in relation to the pit group.
The comments made in relation to the practicality of viewing the lunar minor limits from Warren Field raises a number of issues concerning the contemporary environment. The fact that the alignments noted above could have existed does not prove that the Warren Field site was a viable 'time reckoner' in the past. The original report noted that any significant woodland immediately adjacent to the site could have rendered the view lines associated with astronomic functions impractical (Lancaster 2009, 20). The nature and spatial distribution of early Holocene woodland and the interpretation of the environmental record in relation to opening up of the tree canopy, whether considered natural or anthropogenically modified, is currently a lively and topical debate among environmental archaeologists and ecologists. In many senses this has been stimulated by the work of Frank Vera (2000) and the detection of clearance, either natural, through processes such as tree throw (Brown 1997), or anthropogenically created, perhaps through the use of fire (Innes et al. 2010), is frequently debated. Traditional methodological approaches to these issues, as well as the resolution of such studies used to reconstruct vegetation histories, have been questioned more recently by a number of workers (Fyfe 2007; Smith et al. 2010). In the case of the Mesolithic postholes identified at Stonehenge, a possible comparator for some of the features and associated hypotheses developed at Warren Field, there was evidence for a clearing in the immediate vicinity of the postholes although Allen (1995, 48) notes that environmental evidence from pits, floral and faunal, is notoriously difficult to interpret. Smith et al. (2010, 226), working on contemporary environmental analogues, go further and suggest that the reconstruction of past vegetation (sensu Caseldine et al. 2008) requires the collection and analysis of multiple samples from the immediate site as well as off-site localities.
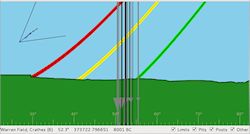
Figure 13: View along the pit alignment toward the north-east and the lunar minor limit. The lunar minor limit is coloured in green, the lunar major limit is red and the path of the sun is yellow. Grey lines indicate pits and the relative size of the features is indicated by a triangle on the lower section of the line. Black lines indicate other features. Insert top left indicates the viewing position in relation to the pit group.
At Warren Field the analysed pollen evidence from the site associated with the Mesolithic environments was relatively well preserved but restricted to five samples from a single context in pit 5, and the report acknowledges that the results may be constrained in chronological terms when applied to such a long-lived monument (Lancaster 2009, 19-20). However, the samples suggest that the alignment was constructed within an open environment with birch/hazel that had an extensive, but not dense, canopy. The data could not discount the existence of clearings and the presence of heath is indicated in the area with some small amounts of grass (Lancaster 2009, 16, 19). These non-woodland pollen types (Non Arboreal Pollen, NAP) are often used to assess openness within the pollen source area but relative to arboreal pollen types, NAP taxa are generally under-represented and therefore % NAP is an underestimate of the openness of the landscape within the source area (Hellman et al. 2009). We should also consider the advances in and evidence from computer simulation models, which are developing pollen-based reconstructions, particularly when considering actual abundance and landscape openness (Gaillard 2013).
The environmental data are clearly important in this discussion and particularly whether the original environmental analyses, which are not at issue, actually falsify the interpretation presented here. In the case of Warren Field the resolution of the data is suggested to represent pollen production over a radius of c. 1-400 metres (Davies et al. 2007, 19) and the critical point in the argument relates to the view towards the midwinter solstice. Any observation at this time of year would have occurred when foliage was largely absent and view lines may well have been relatively clear (see Figure 14). The effect of the sun rising against the dawn sky through a relatively open, and perhaps partially cleared canopy, might well have been adequate for contemporary observers to see and record the event. Having said this there is no dispute that the site itself would still, effectively, have been surrounded by shrubby or open woodland. Whether we can discount any clearance on the basis of current evidence may be debateable but the relative openness of the wood may have rendered a clearance unnecessary in any case. The real point to be taken from this discussion is that the work at Warren Field suggests that further environmental study will be essential to take this aspect of the debate further.
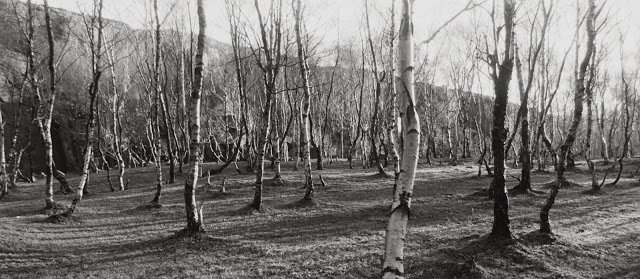
Figure 14: Birch forest in winter (© Will Herman).
This does, however, lead to the issue of why Warren Field was chosen as the site for such a monument? A second application (Passview) was written to identify areas that could provide clear views of the midwinter solstice within the distinctive frame of the Slug Road pass (Figure 15). From this it became clear that such areas were relatively limited and that Warren Field was situated in the largest contiguous area where an observation of the midwinter sunrise, through the Slug Road pass, might have taken place by chance. Sadly, this does not confirm that the alignment was sited here for that purpose. However, if a chance observation were to take place, perhaps in a natural clearing and almost certainly during winter when the foliage was less dense, then the general area of Warren Field was the most likely spot for such an event to occur. This situation may achieve further significance when it is appreciated that this point of the Dee is a focal point in the valley and, apart from the Slug Road pass, the area benefits from access east and west along the river and routes north through the highlands of the Mounth. The area would have been a natural focus for regional hunter-gatherer communities.
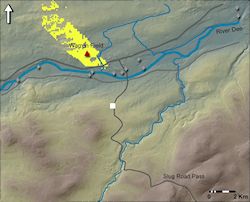
Figure 15: Areas in yellow provide clear views of the midwinter solstice within the frame of the Slug Road pass. Diamonds indicate the position of lithic scatters.
Internet Archaeology is an open access journal based in the Department of Archaeology, University of York. Except where otherwise noted, content from this work may be used under the terms of the Creative Commons Attribution 3.0 (CC BY) Unported licence, which permits unrestricted use, distribution, and reproduction in any medium, provided that attribution to the author(s), the title of the work, the Internet Archaeology journal and the relevant URL/DOI are given.
Terms and Conditions | Legal Statements | Privacy Policy | Cookies Policy | Citing Internet Archaeology
Internet Archaeology content is preserved for the long term with the Archaeology Data Service. Help sustain and support open access publication by donating to our Open Access Archaeology Fund.
File last updated: Fri Jul 12 2013