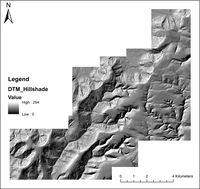
Figure 7: Hillshaded Digital Terrain Model [DTM]. Hillshading can be used to highlight earthworks through the application of shadow from a single azimuth.
To allow non-expert use, the LIDAR data were initially processed using a variety of LIDAR visualisation methods, single and multi-azimuth hillshading (PCA), Sky View Factor and slope severity from the same DTM. The approach adopts a multi-proxy methodology, using a variety of visualisation techniques, currently recommended for archaeological investigation and feature detection (Challis et al. 2011, 288; Bennett et al. 2012, 47). Although the relative benefits of each method may vary across a large landscape, depending on the differing nature of any archaeological features present, the availability of multiple visualisation methods should improve the chance of feature detection and provide qualitative data via user feedback on the effectiveness of each method. All images are visualised in greyscale with black representing low areas/values and white representing high areas/values.
This visualisation method is a hypothetical illumination of a surface that can be used to highlight earthworks through the application of shadow (Crutchley and Crow 2009, 41). In this instance, the single azimuth hillshade was calculated at 30 degrees altitude 315 degrees azimuth (Figure 7). This image is used to offer contrast to the multi-azimuth methods and enable assessment of the value to non-expert users of single vs. multi-azimuth visualisations.
Figure 7: Hillshaded Digital Terrain Model [DTM]. Hillshading can be used to highlight earthworks through the application of shadow from a single azimuth.
PCA, shown in Figure 8, is frequently used to simplify complex, multivariate datasets. The method combines a set of inter-correlated variables into a new set of uncorrelated variables resulting in the generation of 'components' of which much of the variance is attributed to the first few components generated (Devereux et al. 2008, 472). The variables used in the PCA are sixteen hillshaded images equally spaced from zero to 360 degrees. The PCA analysis combines these images, producing an image where 95% of the variance, and therefore possible archaeological features, is present in the first three components. This will help minimise the loss of visibility resulting from illumination direction.
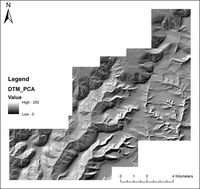
Figure 8: Principal Component Analysis [PCA] of Digital Terrain Model [DTM]. PCA is typically used in lidar data visualisation to combine hillshaded raster images from different azimuths into a single composite image to improve feature detection.
The degree of slope severity is calculated by degrees according to the principles outlined by Jones (1998). This method, illustrated by Figure 9, can provide useful complementary information when used with other visualisation methods, and can prove particularly useful in identifying archaeological features with steep well-defined edges (Bennett et al. 2012, 47; Challis et al. 2011, 285).
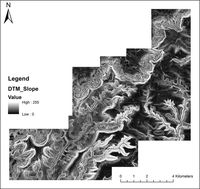
Figure 9: Slope analysis, which calculates steepness or the degree of incline of a surface, of Digital Terrain Model [DTM]. This can be useful visualisation, providing complimentary information regarding a features characteristics, when used in conjuncture with multiple visualisation methods.
In common with the PCA method, the technique attempts to overcome problems arising from illumination direction of the DEM using diffuse illumination. A celestial hemisphere is calculated for each point and illuminated by a fictive light source (Zakšek et al. 2011, 402; Kokalj et al. 2011). The processing of the LIDAR data was conducted using IDL Virtual Machine Application - skyview_sa_v1_s11 developed by the Scientific Research Centre of the Slovenian Academy of Sciences and Art, which is currently freely available to the public. Suggested parameters for calculation of SVF vary according to the form of the cultural heritage under scrutiny, with large search radii being appropriate for hollow ways or agricultural terraces and smaller radii being suitable for burial mounds, remains of ancient buildings and ridge and furrow (Zakšek et al. 2011, 412). Given the potentially wide variety of features present in the study area, no single parameter setting may be suitable for the entire area. However, higher settings resulted in significantly longer processing time for ostensibly little improvement in visual clarity. Consequently, to minimise processing time, the parameters used are Search Direction: 16, Search Radius: 30 and Vertical Exaggeration: 1 (Figure 10).
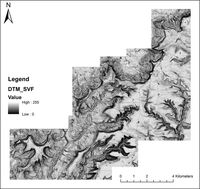
Figure 10: Sky View Factor [SVF] of Digital Terrain Model [DTM]. SVF is a lidar visualisation technique based on diffuse illumination designed to overcome problems affecting feature detection associated with direct illumination, shaded relief methods.
One technique, known as Local Relief Modelling (LRM) (see Hesse 2010), was evaluated but omitted from the final application as results tended not to add any significant clarity to features compared to the other methods chosen. This could be because of the variability of the landscape, meaning that one specific parameter value, in this case kernel size, may be suitable for only a small area and results in lack of clarity for large swathes of the image. Smaller individual raster tiles were processed with varying kernel size as applicable, but resulted in unacceptable processing time and a visually complex final visualisation arguably unsuited to a non-expert audience.
Internet Archaeology is an open access journal based in the Department of Archaeology, University of York. Except where otherwise noted, content from this work may be used under the terms of the Creative Commons Attribution 3.0 (CC BY) Unported licence, which permits unrestricted use, distribution, and reproduction in any medium, provided that attribution to the author(s), the title of the work, the Internet Archaeology journal and the relevant URL/DOI are given.
Terms and Conditions | Legal Statements | Privacy Policy | Cookies Policy | Citing Internet Archaeology
Internet Archaeology content is preserved for the long term with the Archaeology Data Service. Help sustain and support open access publication by donating to our Open Access Archaeology Fund.
File last updated: Wed Oct 23 2013