Among the remaining anomalies, there are a large number of medium-strong and strong, approximately circular, magnetic anomalies (Figure 27). These may represent a variety of features including pits, hearths or sunken floors. Based on a comparison with the excavated areas, however, many of the large anomalies, measuring 2-4m in diameter, probably represent sunken-featured buildings (SBFs) belonging to the pre-fortress settlement.
Concentrations of these positive magnetic anomalies are found adjacent to areas where such features are noted in excavations. Aspects of the use and backfilling of the buildings, e.g. a high content of anthropogenic material or burnt layers, result in the detected increased magnetic signal. It has been shown elsewhere that remaining metal (ferrous) artefacts within the buildings may also contribute to high magnetic responses over this type of feature (Powlesland and May 2010). The strength and character of a number of these anomalies suggests that some of the SFBs (sunken-featured buildings), for example those around coordinates [50m, 20m] and [80m, 50m], may have burnt down; this interpretation is supported by the archaeological evidence indicating the destruction of the pre-fortress settlement.
Viewing the greyscale magnetic data (Figure 23), the similarity of magnetic anomalies that have been interpreted as SFBs, ferrous and geological response is very apparent; categorisation has thus been primarily based on the shape, and to a lesser extent the relative strength, of responses when viewed as an xy plot, as illustrated in Figure 28. Responses interpreted as archaeological have generally shown more structure than the characteristic sharp, narrow 'spikes' caused by iron. The geological responses, often also resulting from accumulated backfill, have much in common with the archaeological responses; their interpretation has relied particularly on their context and distribution as part of the linear 'chains' of responses with limited strength/shape variation that dominate the geology on this site (and which are more apparent in the xy data). It should be noted that, on the whole, the strength of an anomaly cannot be reliably used to determine the nature of its origin: the strength of the detected magnetic signal decreases rapidly with distance from its origin (i.e. the depth of the feature), while the heterogeneous nature of the sub-surface introduces further unknown influences to any measured absolute values (see Aspinall et al. 2008, 68-74).
These large circular anomalies cluster in three areas. A first group is found in the eastern half of the fortress interior. This cluster extends from a large excavated area where a concentration of SFBs was found, a fact that strengthens the interpretation of these features as relating to further similar features. Some 25 to 32 possible SFBs can be counted in this cluster. Some 10 similar anomalies can be noted adjacent to this concentration in areas east of the fortress.
The second group of similar magnetic anomalies is found to the west of the fortress, where c. 77-84 are consistent with SFBs. The anomalies in this area are scattered, although at least three rows of likely SFBs can be observed, two of which appear to lead to the west gate of the fortress (leading approximately from coordinates [-200m, 60m] and [-210m, -80m] towards the gate area). Their interpretation as SFBs is substantiated by observations made in a series of trial trenches excavated in this area in 1950-51. During these excavations a number of SFBs were encountered, but owing to the limited extent of the trenches it could not be established whether they represented sporadic outliers or formed part of a wider cluster; their occurrence, however, can now be observed to coincide with the anomalies noted in the magnetic survey. A number of smaller positive anomalies are also located in this area and are thought to represent cut features, which are likely to be associated with this occupation.
A third group of possible SFBs occurs in the south-east quadrant of the fortress and extends into the adjacent area outside the fortress. While the outlines of many of these anomalies are of varying clarity, at least 38 anomalies in this area may represent SFBs. Only two excavation trenches, of limited size, were previously opened in this area, and the occurrence of two or possibly three SFBs in both of these trenches could not be related to any wider pattern. They would now seem to support the suggestion, based on the magnetic evidence, of a larger group of SFBs that was not previously recognised. The observations could indicate that one or several additional farms, with SFBs and other farm buildings, were located here, or, considering the location near the coast, the buildings could relate to a special activity area connected with a landing place. In total, the survey would suggest that at least 137, and possibly up to 200, SFBs can be added to the c. 150 encountered during excavations.
In the northern half of the NW quadrant of the fortress area, interpretation of the gradiometer data is rendered difficult by the dominance of the geological responses noted above: while it is likely that most of the magnetic anomalies in this area represent geology, the seeming absence of archaeology may be misleading. However, the apparent lack of evidence for SFBs here seems to corroborate the observation that few SFBs were noted in the excavated parts of this area.
As a rule geophysical survey results do not offer chronological resolution. However, for a number of the presumed SFBs identified in the gradiometry survey it is possible to suggest a phasing in relation to the fortress by combining results from the earlier excavations with observations on the spatial distribution. Among the SFBs found to the west of the fortress, two linear clusters appear to be orientated towards the western gate of the fortress. While this could be coincidental, three excavated buildings in this group are among the very few features in and around the fortress area that can be related to post-fortress (i.e. 11th century) activity (SFB nos 2018, 2019 and 2029). The rows of SFBs presumably followed a path that emerged after the construction of the fortress. The observations thus add to our understanding of a hitherto ill-defined post-fortress phase of activity, and the number of SFBs associated with these rows suggests that this activity may have been more substantial than the excavations have indicated.
Another line of SFBs have been identified in the magnetic data in the south-western extent of the survey area; whereas those mentioned above appear to be aligned with the west gate, this row forms a curve (from coordinates [-220m, -80m] towards [-170m, -80m], then bending northwards towards [-145m, -10m]) that terminates in the area just to the south of the gateway itself. An SFB in the gateway area (no. 748), which may be assigned to this group, was shown during excavations to have been cut by features relating to the fortress. Two other SFBs from the southern end of the same row (nos 2032 and 2033) were cut by features relating to a building from the pre-fortress settlement (house GS). None of the three excavated SFBs from this row contained datable materials from the late Viking Age (late 10th-11th century). It can thus be suggested that all of the c. 20 possible SFBs identified in this row belong to the pre-fortress settlement.
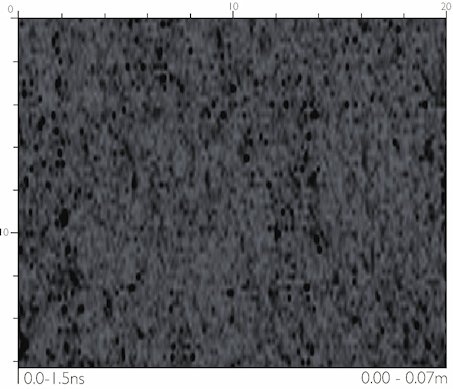
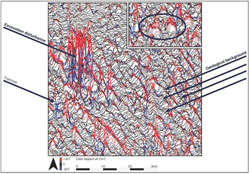
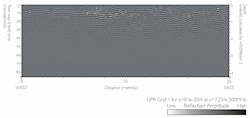
Using the gradiometer data to guide further investigation, GPR Grid 1 was located to the south-west of the fortress, over several of the strong magnetic anomalies that were interpreted as SFBs (Figure 22). Below disturbances very close to the surface, time-slices (Figure 29) clearly show old plough furrows running N–S, visible to depths of almost 0.6m. In the centre of the data (x=10), a clear linear anomaly on the same orientation as the plough furrows is present at depths of 0.42-0.59m; also visible in individual profiles, this is presumed to reflect modern drainage. Below this, the data are dominated by a north-east/south-west curvilinear band of strong responses consistent with the geological responses identified in the magnetic data; it is likely that these responses are augmented by 'noise' generated by old excavations located in the western portion of this survey grid. However, several discrete, though poorly defined, anomalies suggesting archaeological activity are present within this data, albeit identifiable following close comparison with the magnetic data (see time-slice at 15.5-19.0ns). One of these, a strong subcircular reflection approximately 2.5 x 2.5m, is visible within the geology at x=8,y=8 between depths of 0.59-0.93m. Examination of the individual profiles (Figure 30) suggests it is consistent with an SFB of the type found previously on the site. These GPR results exemplify the difficulties of working on this geology, but, on balance, the characteristic nature of the magnetic responses is such that the interpretation of these as probable SFBs seems a reasonable one.
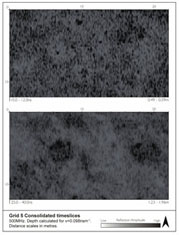
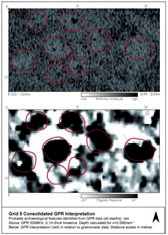
Further GPR survey was conducted over grids in the north-eastern quadrant of the fortress interior. Grid 5 was located over particularly well-defined, strong magnetic anomalies believed to represent SFBs in the 'eastern cluster'. The time-slices (Figure 31) show faint plough furrows running north–south, as well as the ubiquitous geological responses running north-west/south-east. The location of this grid incorporates parts of two anticipated fortress houses and a separating street, although no evidence for these have been categorically identified (see above). However, between 0.2m and 1.81m depth, a number of responses are noted that are presumed archaeological. The most prominent of these are two roughly circular anomalies, each approx. 3.5-4m in diameter. Visible below depths of c. 0.5m, they are particularly distinctive at greater depths, where their surroundings are 'quieter'. In the shallower- to mid-range of the data, at least six additional subcircular anomalies of a similar nature are identifiable, with diameters varying between 2 and 4m and the appearance of responses from planar floor surfaces. The majority of these also contain a strong response in a central position, perhaps raising the possibility of hearth stones or post supports. Similarly, the deepest views of the two most pronounced features suggest several individual, discrete reflections generated around the circumference, which can be compared with postholes or stones revealed by excavation (see Figure 14 and Figure 15). These properties are also visible in the 'thicker' time-slices of Figure 32. Although not captured in the time-slices, observation of ring-shaped anomalies in the 3D data outlining the upper level of several of the features suggested the possibility of comparison with findings made during the excavations of low surrounding walls that were constructed of subsoil material and preserved in a few buildings (cf. Figure 10).
Comparing this dataset with the gradiometer survey, a close positional correspondence is apparent between the major anomalies detected in both surveys (Figure 33). The two most prominent magnetic anomalies were interpreted as SFBs and the GPR results are consistent with this; the datasets suggest that the features comprise sunken centres with distinct floor levels, perhaps with indications of interior structure. While the other GPR anomalies correspond with weaker magnetic responses, these magnetic responses are also positive and discrete; again, their interpretation as SFBs or similar cut features is considered reasonable.
GPR Grid 4 was located some 30m further north, still within the north-east quadrant of the fortress. The gradiometer responses were slightly less pronounced in this area, but three circular anomalies had been interpreted as probable or possible SFBs; similar magnetic anomalies in this area had been interpreted as geological. The shallowest time-slices (Figure 34) show clear reflections from part of the circular system of plough furrows, with persistent north-west/south-east geological trends at greater depth (and occasional perpendicular geological linears). Overall, the GPR slices and profiles indicate a complex subsurface makeup, comprising both geological formations and anthropogenic disturbance. An informed interpretation can, however, be tentatively advanced. Of the two magnetic anomalies in Grid 4 that are most convincingly interpreted as SFBs (see Figure 22 and Figure 23), the westernmost is not evident in the GPR data; the second of these anomalies coincides with an area of increased GPR reflections [x=10, y=9], one of three similar circular irregularities measuring between 1 and 2m in diameter that are noticeable in the time-slices produced for 0.78-1.08m depth. The similar GPR anomaly to the north-west of this coincides with the magnetic anomaly interpreted as a possible SFB. The third circular GPR anomaly visible at this depth, which also suggests a planar floor/base level, is located in close proximity to a ferrous signal in the magnetic data, but there is no other direct suggestion of archaeology; however, the location is cut by a north–south magnetic discontinuity that extends beyond the GPR grid and appears to be of agricultural origin, aligning with other ploughing trends visible at intervals across the fortress. It is therefore possible that, while the magnetically enhanced fill has been redistributed by the plough, the floor level remains sufficiently intact to produce a (perhaps truncated) response in the GPR. The reconstructed plan of the fortress suggests that Grid 4 should contain a large proportion of a fortress house and street, so it is also possible that the geophysical responses may stem from features related to this period of activity. The GPR data also includes a conspicuous U-shaped response [x=15, y=3] at a similar depth and aligned north-west/south-east, with a profile that varies with depth; it appears to be part of the geological trend visible in the gradiometer data which extends beyond the GPR survey grid. The geophysics is not conclusive and this is an area that would benefit from clarification by excavation.