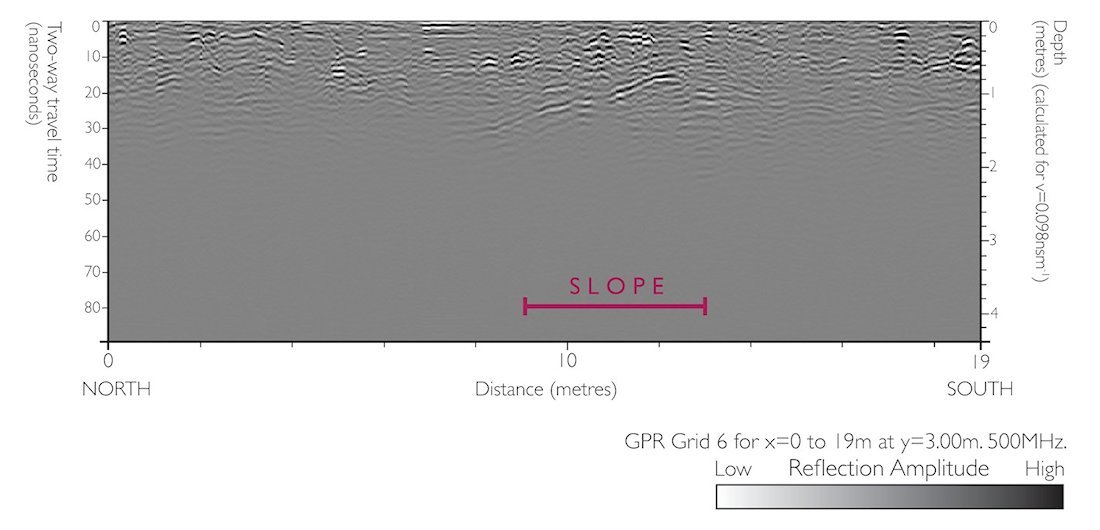
Figure 37: Single profile running north–south through Grid 6 at x=24m. The slope highlighted in Figure 35 runs between approximately x=9 (top) and x=13 (bottom) (marked). Note that the lack of topographic correction has the effect of seemingly detecting pronounced strata that run uphill towards the surface in this area, when in fact the stratigraphy is probably closer to horizontal, with the effect caused by the converse running of the antenna downhill and therefore closer (in terms of response time) to the sub-surface cause of the reflection. The position of the surface reflection visible at c. 9-13m corresponds to the gateway area off the fortress and may represent a flat area dug into the slope, similar to open areas in other gateways. The profile demonstrates the various areas of disturbance The time-slices (Figure 38) show that below c.
Figure 37

Internet Archaeology is an open access journal based in the Department of Archaeology, University of York. Except where otherwise noted, content from this work may be used under the terms of the Creative Commons Attribution 3.0 (CC BY) Unported licence, which permits unrestricted use, distribution, and reproduction in any medium, provided that attribution to the author(s), the title of the work, the Internet Archaeology journal and the relevant URL/DOI are given.

Terms and Conditions | Legal Statements | Privacy Policy | Cookies Policy | Citing Internet Archaeology

Internet Archaeology content is preserved for the long term with the Archaeology Data Service. Help sustain and support open access publication by donating to our Open Access Archaeology Fund.