The final scale investigated here is the so-called 'local' scale, in which 5x5 degree tiles were selected from the same four regions as before, to explore the way patterns in these datasets resolve themselves at scales relevant to hominin movements. These blocks were located as follows: in east Africa, between 35-40°E and 0°N-5°S, in central Africa, between 10-15°S and 15-20°E, in south Africa, between 20-25°E and 30-35°S, and in west Africa, between 10-15°E and 5-10°N. The precise locations of these can be seen on Figure 2.
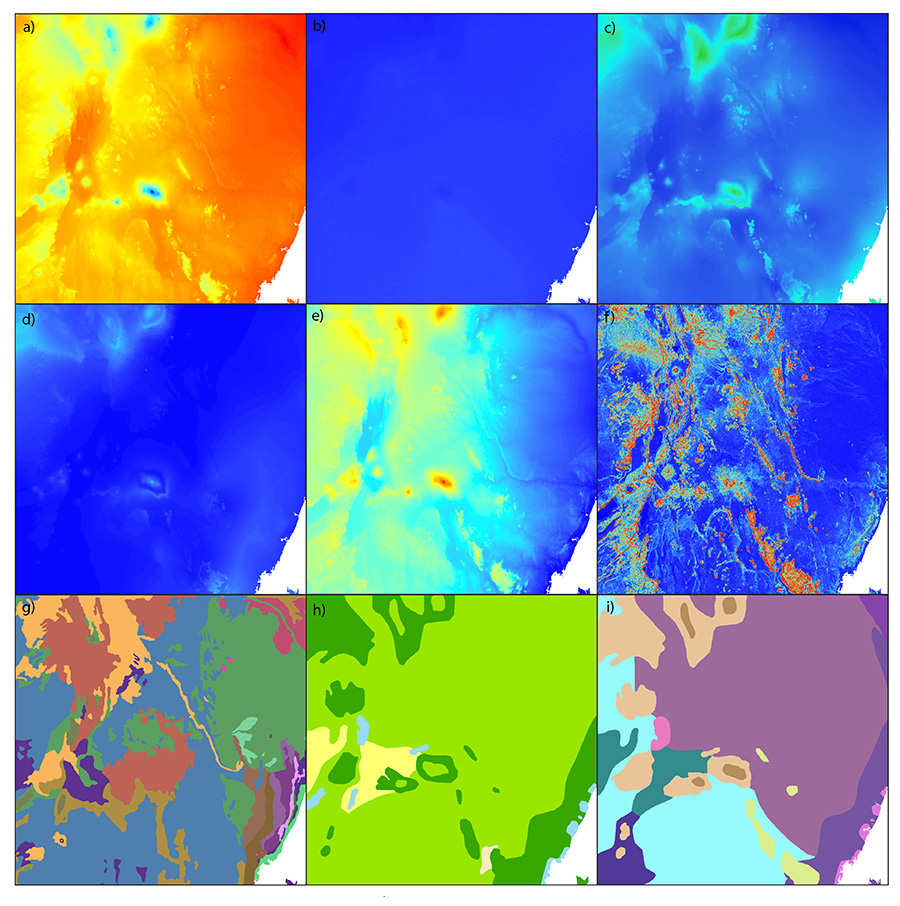
Maps of the local landscape in east Africa can be seen in Figure 8. In east Africa, as this figure shows, the dominance of the physical landscape over spatial patterns in environments is even more apparent at the local scale than it was at the regional. There is no trace of latitutinal banding even in the climatic variables (Figure 8a-d), which instead show close links to the distribution of topographic peaks and troughs (Figure 8e). In fact, pretty much every variable on these maps is closely correlated with the distribution of topography, with the possible exception of surficial geology (Figure 8g), which is more variable than the basic shape of the landscape might initially suggest though some units do show boundaries that fit with topographic features. Of particular prominence in all maps save the geological one are the peaks of Kilimanjaro and nearby mountains, which have their own ecoregions and microclimates. At this scale then, the dominance of the physical landscape increases – in east Africa, which was physical landscape-dominated at the regional scale too, until there is no remaining trace of the classic latitudinal banding patterns associated with climate at the continental scale.
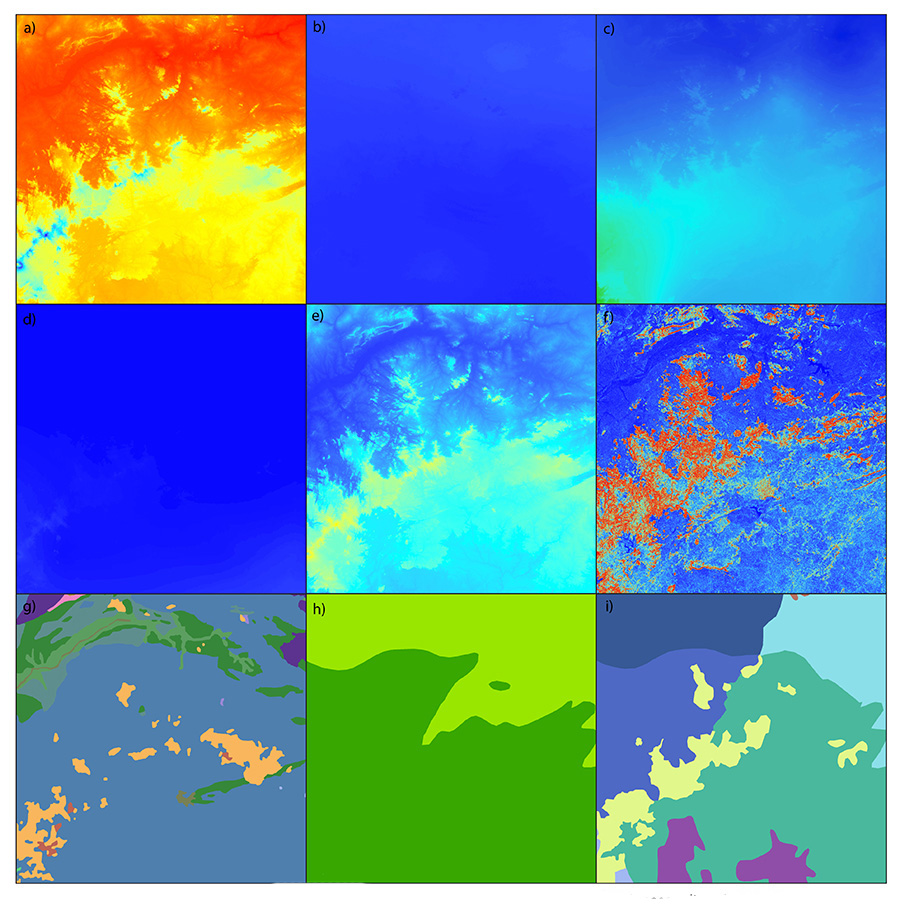
Local maps of the west African tile can be seen in Figure 9. As these maps show, at this small scale, although there is still some (weak) evidence of latitudinal banding patterns in the climatic variables (Figure 9a-d, though b and d are nearly uniform at this scale), these patterns are modified by the effects of the Cameroon line topography (itself visible in Figs 9e and f). In fact, at the local scale, all of the environmental variables studied here show evidence of influence from the physical landscape. The correlation between topography and roughness is very strong at the local scale here, and the topographic peaks are reflected in areas with a different geology (Figure 9g) and a different peak ecoregion (Figure 9i). However, the correlation between vegetation and ecoregion distributions (Figure 9h-i) is less clear. The effect of the physical landscape on other variables has also increased in magnitude as we move from the large to the small scale in western Africa, then, though it has not completely wiped out the banding patterns as was the case in east Africa.
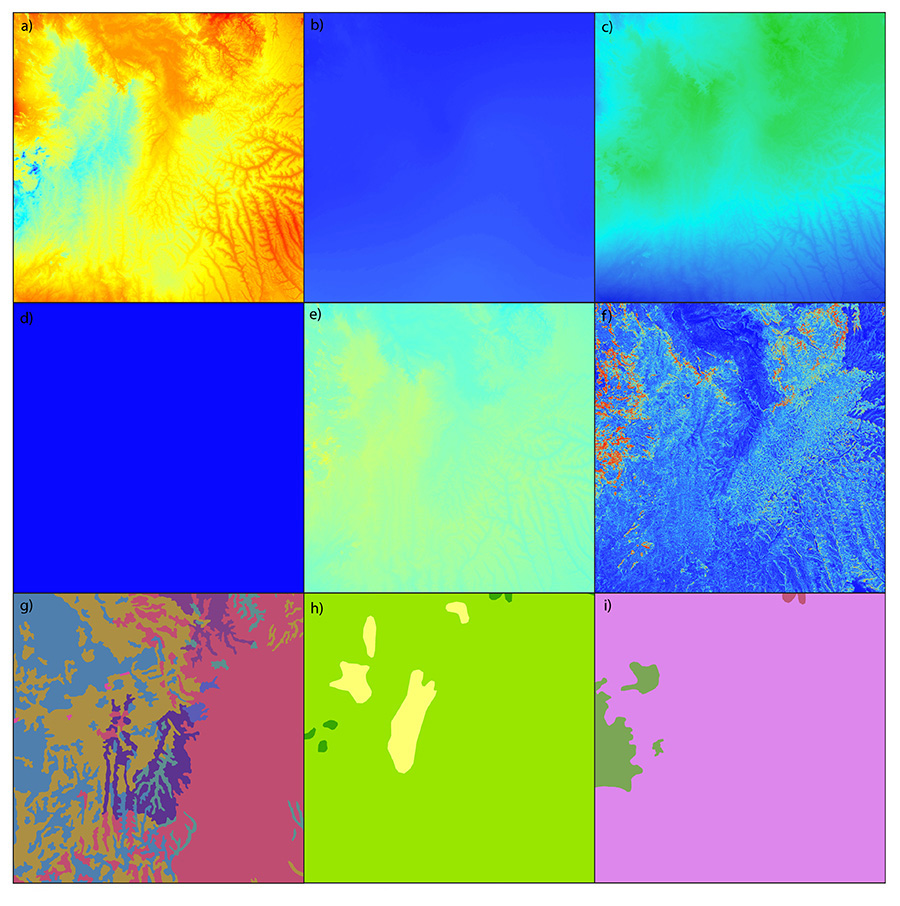
Maps of the local landscape in central Africa can be seen in Figure 10. At this scale in central Africa, latitudinal banding is only visible on the temperature seasonality and rainfall maps (Figure 10b-c), and every other map is irregularly patterned, with the exception of the rainfall seasonality map (Figure 10d), which is uniform. There is some minor topographic variation (Figure 10e), some of which maps neatly onto the variations in roughness visible on Figure 10f, where roughness peaks seem to be associated with the boundaries between higher and lower altitude blocks. Maps of vegetation and ecoregions (Figure 10h-i) are unclear, with just a few patches of closed and open vegetation in a dominant matrix of semi-open vegetation (Figure 10h) and Angolan miombo woodlands (coloured pink) dominating the ecoregion map (Figure 10i). The anomalies on these two maps do not align neatly at this scale, presumably because of the different aspects of vegetation and biodiversity measured by each. Once again, maps of the local area of central Africa seem to show an increasing impact of the physical landscape – in this case, particularly terrain roughness rather than altitude – on all other variables. Central Africa, however, seems to be intermediate between east and west in the degree to which this physical landscape dominance is apparent.
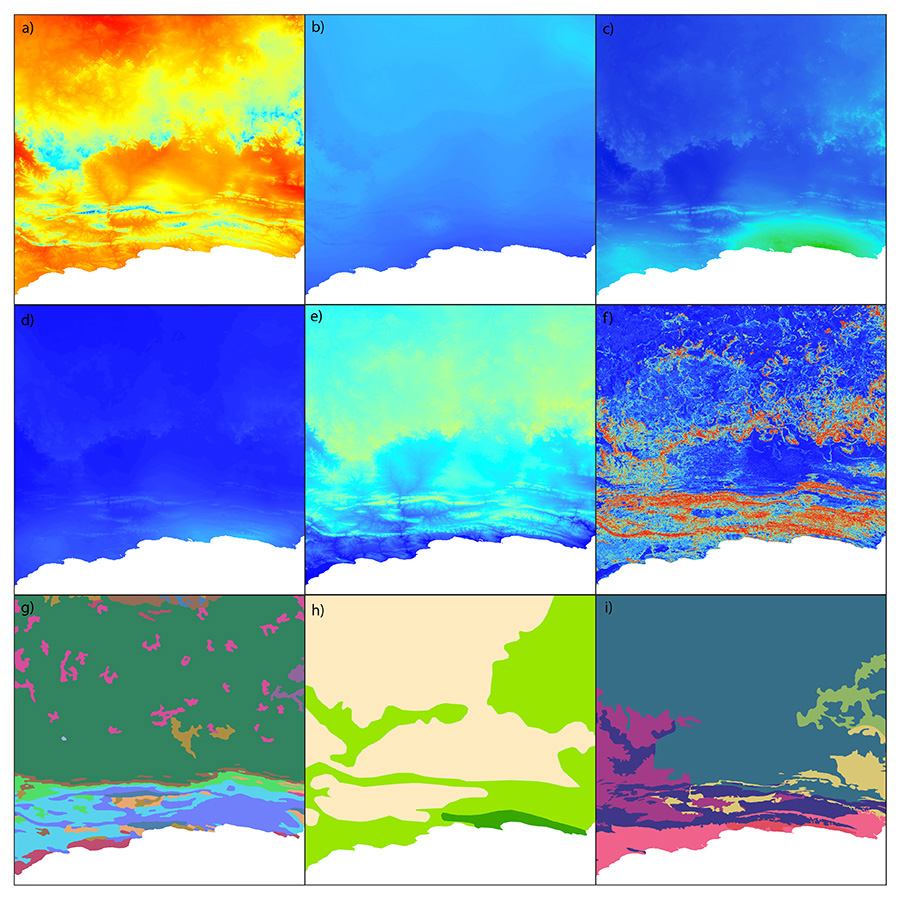
The final local maps, of south Africa, can be seen in Figure 11. These show significant latitudinal banding, in contrast to the other areas, though this is associated specifically with a suite of narrow latitudinal ridges in the topographic and geology maps (Figure 11e-f) rather than appearing to represent larger-scale climatic bands. These bands recur in the maps of geology, ecoregions, topography, roughness and the climatic variables (where overall variation is sufficient for patterns to be apparent; Figs 11a-g and j), and to a slightly lesser extent on the vegetation map (Figure 11h). Even in south Africa, then, the impact of the physical landscape appears to increase as you move from the large to the smallest scales, though in this case the effect has been to reinstate the latitudinal banding patterns visible at the continental scales in at least some of the same variables. Once again, at this scale, there is a relatively tight correlation between topography and terrain roughness, and indeed between topography and the distribution of other variables.
Internet Archaeology is an open access journal based in the Department of Archaeology, University of York. Except where otherwise noted, content from this work may be used under the terms of the Creative Commons Attribution 3.0 (CC BY) Unported licence, which permits unrestricted use, distribution, and reproduction in any medium, provided that attribution to the author(s), the title of the work, the Internet Archaeology journal and the relevant URL/DOI are given.
Terms and Conditions | Legal Statements | Privacy Policy | Cookies Policy | Citing Internet Archaeology
Internet Archaeology content is preserved for the long term with the Archaeology Data Service. Help sustain and support open access publication by donating to our Open Access Archaeology Fund.
File last updated: Wed Mar 4 2015