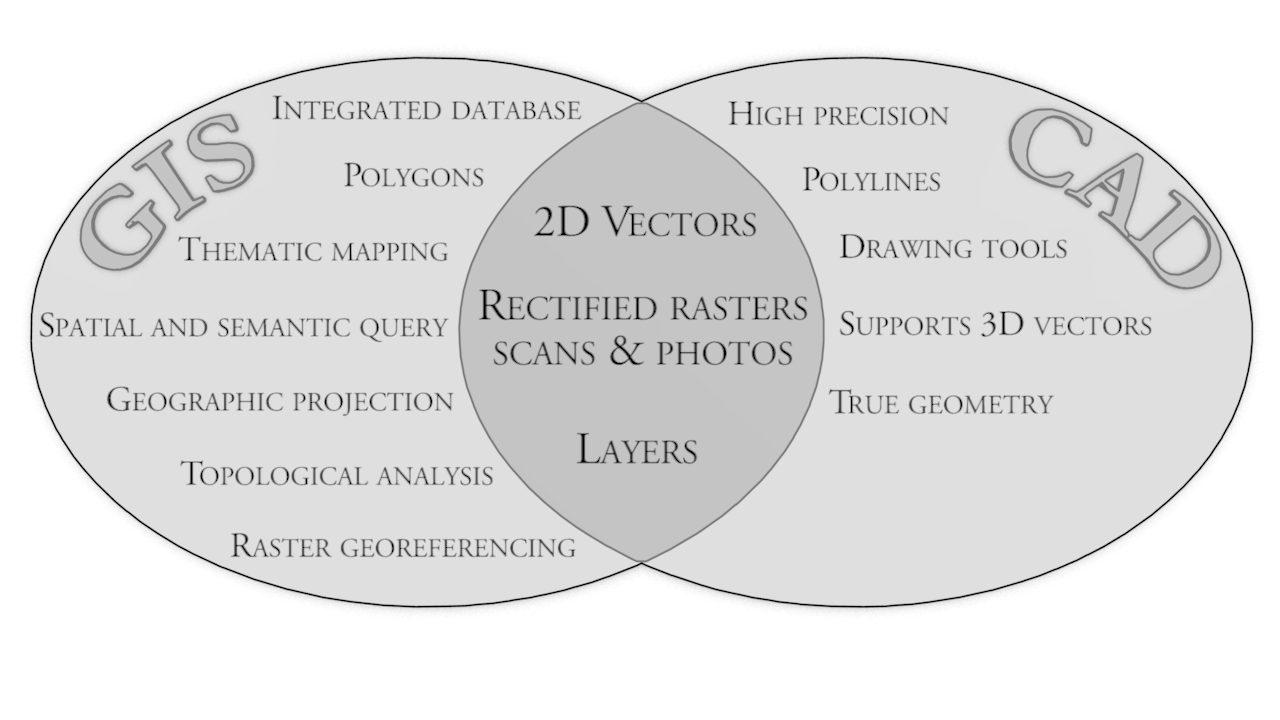
Figure 1: GIS and CAD. The 'traditional' features of Geographic Information System and Computer-Aided Design, converging on what has become an ideal for archaeological documentation
Figure 2: (VIDEO) Comparing box-cut and single context planning of posthole excavation in Denmark and UK. The Danish example is of the excavation of Viking Age longhouses in Jelling (Nielsen 2015; Holst et al. 2013), the UK example is the Lyminge Archaeological Project, University of Reading
Figure 3: Parallel series of digital data. Textual, spatial and complex spatial
Figure 4: (VIDEO) The advent of DGPS systems meant that field recording could be done faster. Spatial data was 'born digital' and not derived from hand drawings. Illustration based on data from the Jelling Project (Nielsen 2015; Holst et al. 2013)
Figure 5: (VIDEO) Conceptual illustration of the documentation of an archaeological excavation; photo-rectification based on measured control points transforms photographs into a type of field recording data, which may be used as basis for drawings and vectorisations. Illustration based on data from the Jelling Project (Holst et al. 2013)
Figure 6: (VIDEO) Conceptual illustration of the documentation of an archaeological excavation; real-time 3D vector data acquisition using for example optical ranging with total station or point tracking by radio waves through RF positioning systems. Illustration based on data from the Alken Enge excavation (Holst et al. in press)
Figure 7: (VIDEO) Conceptual illustration of the documentation of an archaeological excavation; generating 3D point clouds by 3D scanner. Illustration based on data from the Alken Enge excavation (Holst et al. in press)
Figure 8: (VIDEO) Conceptual illustration of the documentation of an archaeological excavation; generating 3D textured meshes by Structure from Motion. Illustration based on data from the Alken Enge excavation (Holst et al. in press)
Figure 9: (VIDEO) Different data representations. The mainstream raster and vector representations are being supplemented by new types of primary data such as point clouds and derived 3D meshes on one side, and voxel representation on the other. Illustration based on data from the Alken Enge excavation (Holst et al. in press)
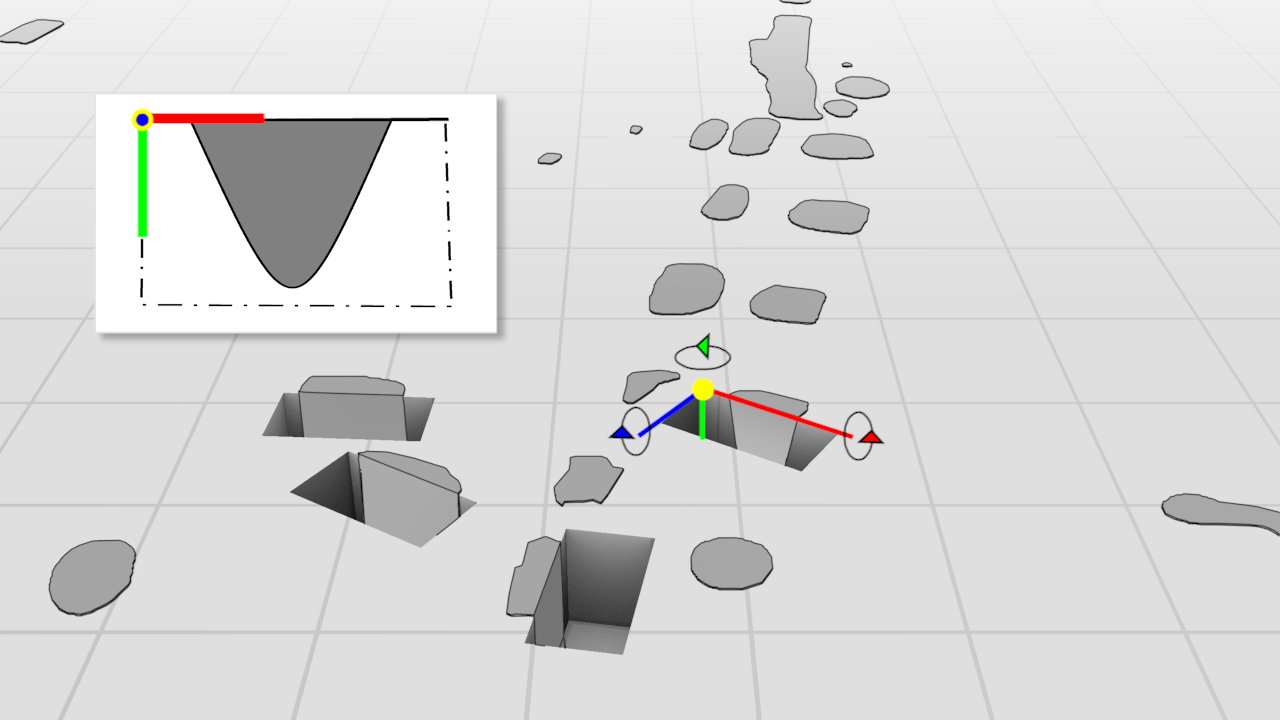
Figure 10: Conceptual illustration of how the Danish excavation methods could gain from a system that allows 3D georeferencing of individual 2D fragments. Illustration based on data from the Jelling Project (Holst et al. 2013)
Figure 11: (VIDEO) Conceptual illustration of how classification of point clouds and meshes could be done. Also demonstrating preview of online web 3D viewer, which supports selection of classified 3D meshes (in development by the author). Illustration based on data from the Alken Enge excavation (Holst et al. in press)
Figure 12: (VIDEO) Conceptual illustration of how voxels may be used for representing volumes of archaeological context rather than surfaces. Illustration based on data from the Alken Enge excavation (Holst et al. in press)
Internet Archaeology is an open access journal based in the Department of Archaeology, University of York. Except where otherwise noted, content from this work may be used under the terms of the Creative Commons Attribution 3.0 (CC BY) Unported licence, which permits unrestricted use, distribution, and reproduction in any medium, provided that attribution to the author(s), the title of the work, the Internet Archaeology journal and the relevant URL/DOI are given.
Terms and Conditions | Legal Statements | Privacy Policy | Cookies Policy | Citing Internet Archaeology
Internet Archaeology content is preserved for the long term with the Archaeology Data Service. Help sustain and support open access publication by donating to our Open Access Archaeology Fund.