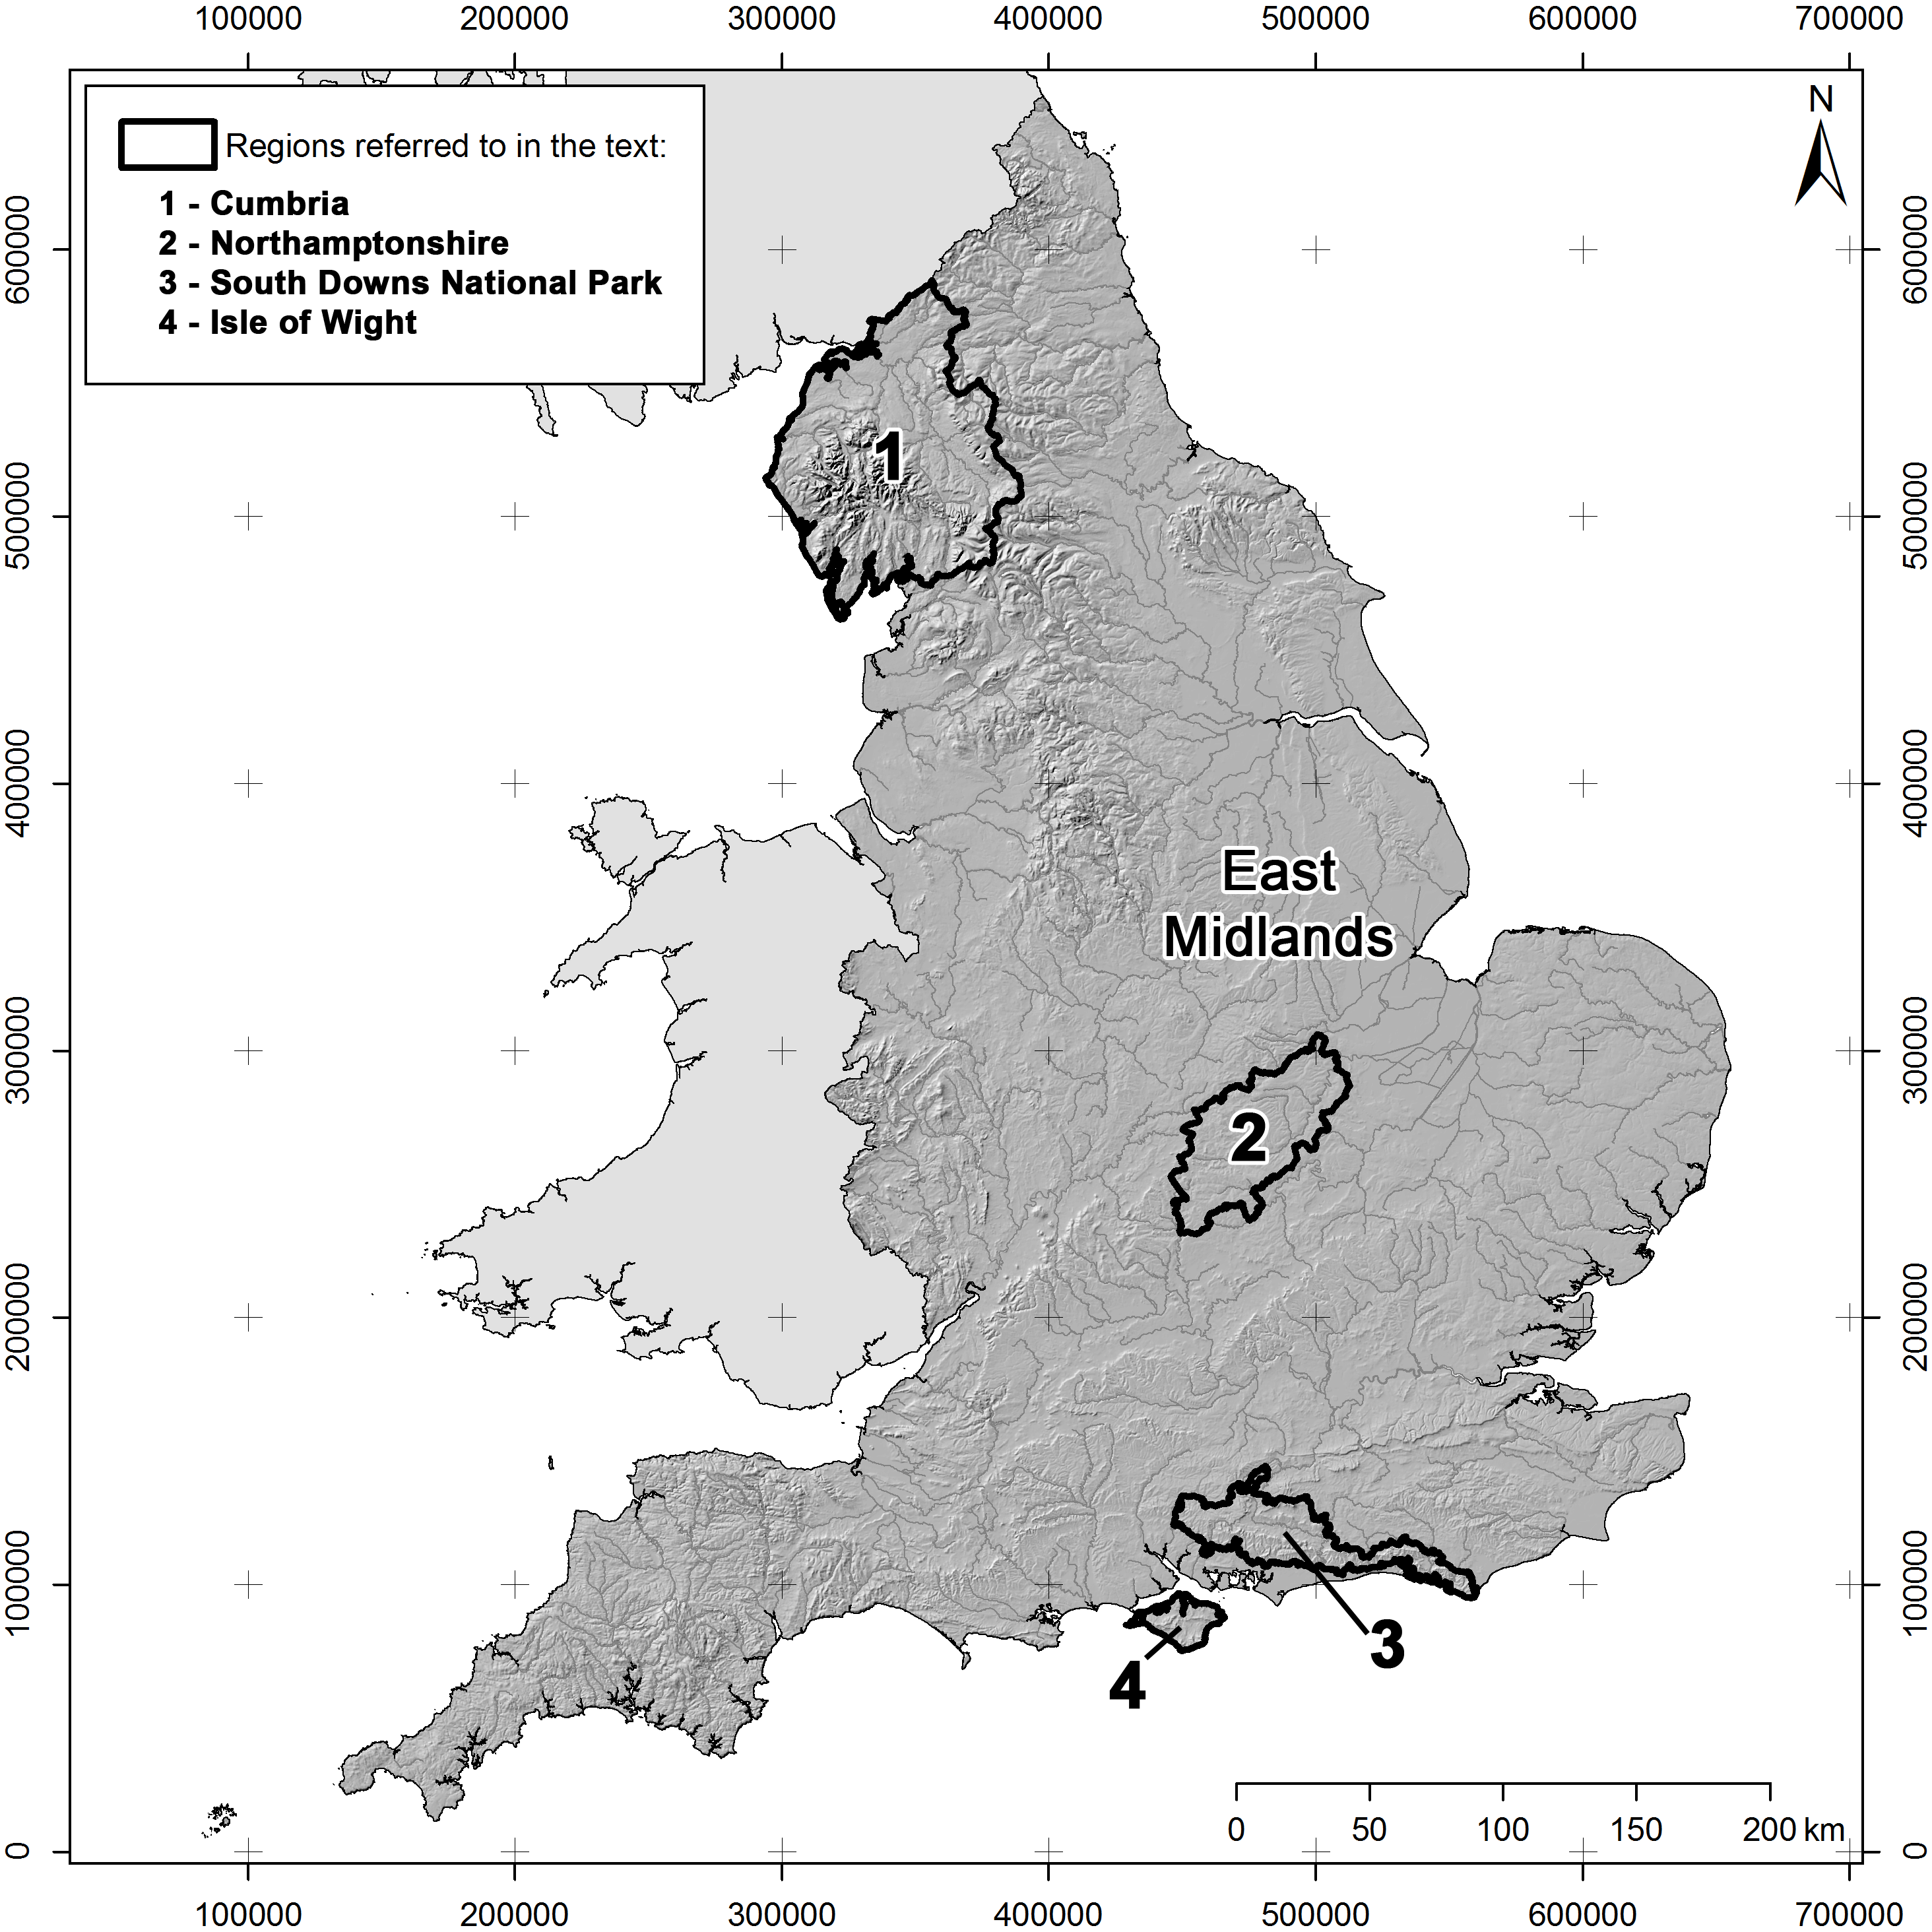
Figure 1: Study location showing key UK regions mentioned in the text
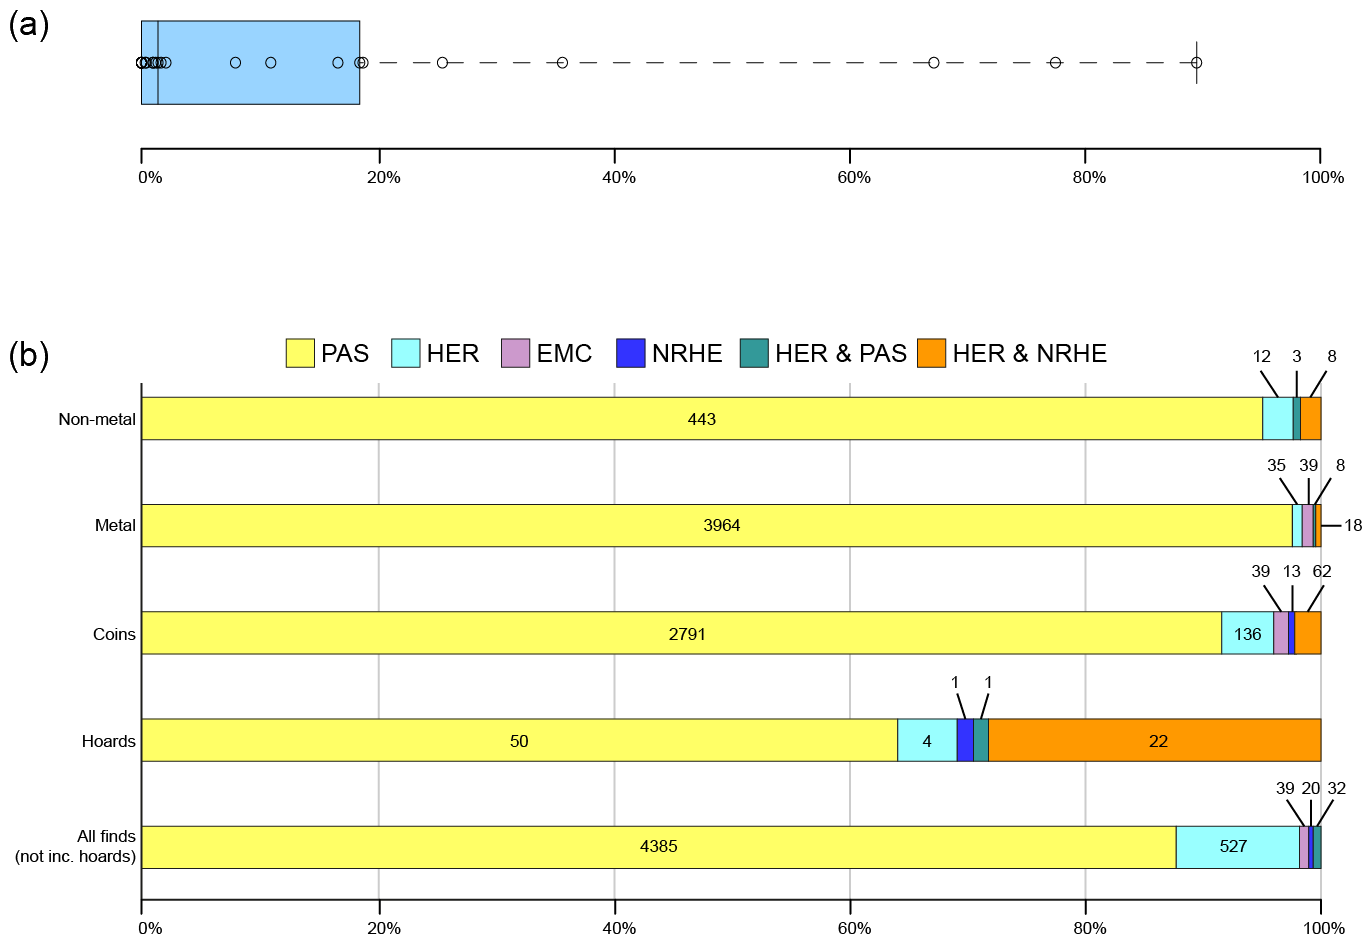
Figure 2: Relationships between object records held in different UK datasets: a) 'box and whisker' plot showing the percentage overlap between PAS/EMC records and HER records based on evidence from 35 10x10 km squares located across England) (see Cooper and Green 2016, 285, for the location of these squares) (the thick black vertical line shows the median value for each class; the 'box' shows the interquartile range; the horizontal 'whiskers' show the overall distribution of values) and b) chart showing the distribution of key sets of object records (non-metal, metal, coins, hoards and all finds excluding hoards) across different datasets for the Isle of Wight
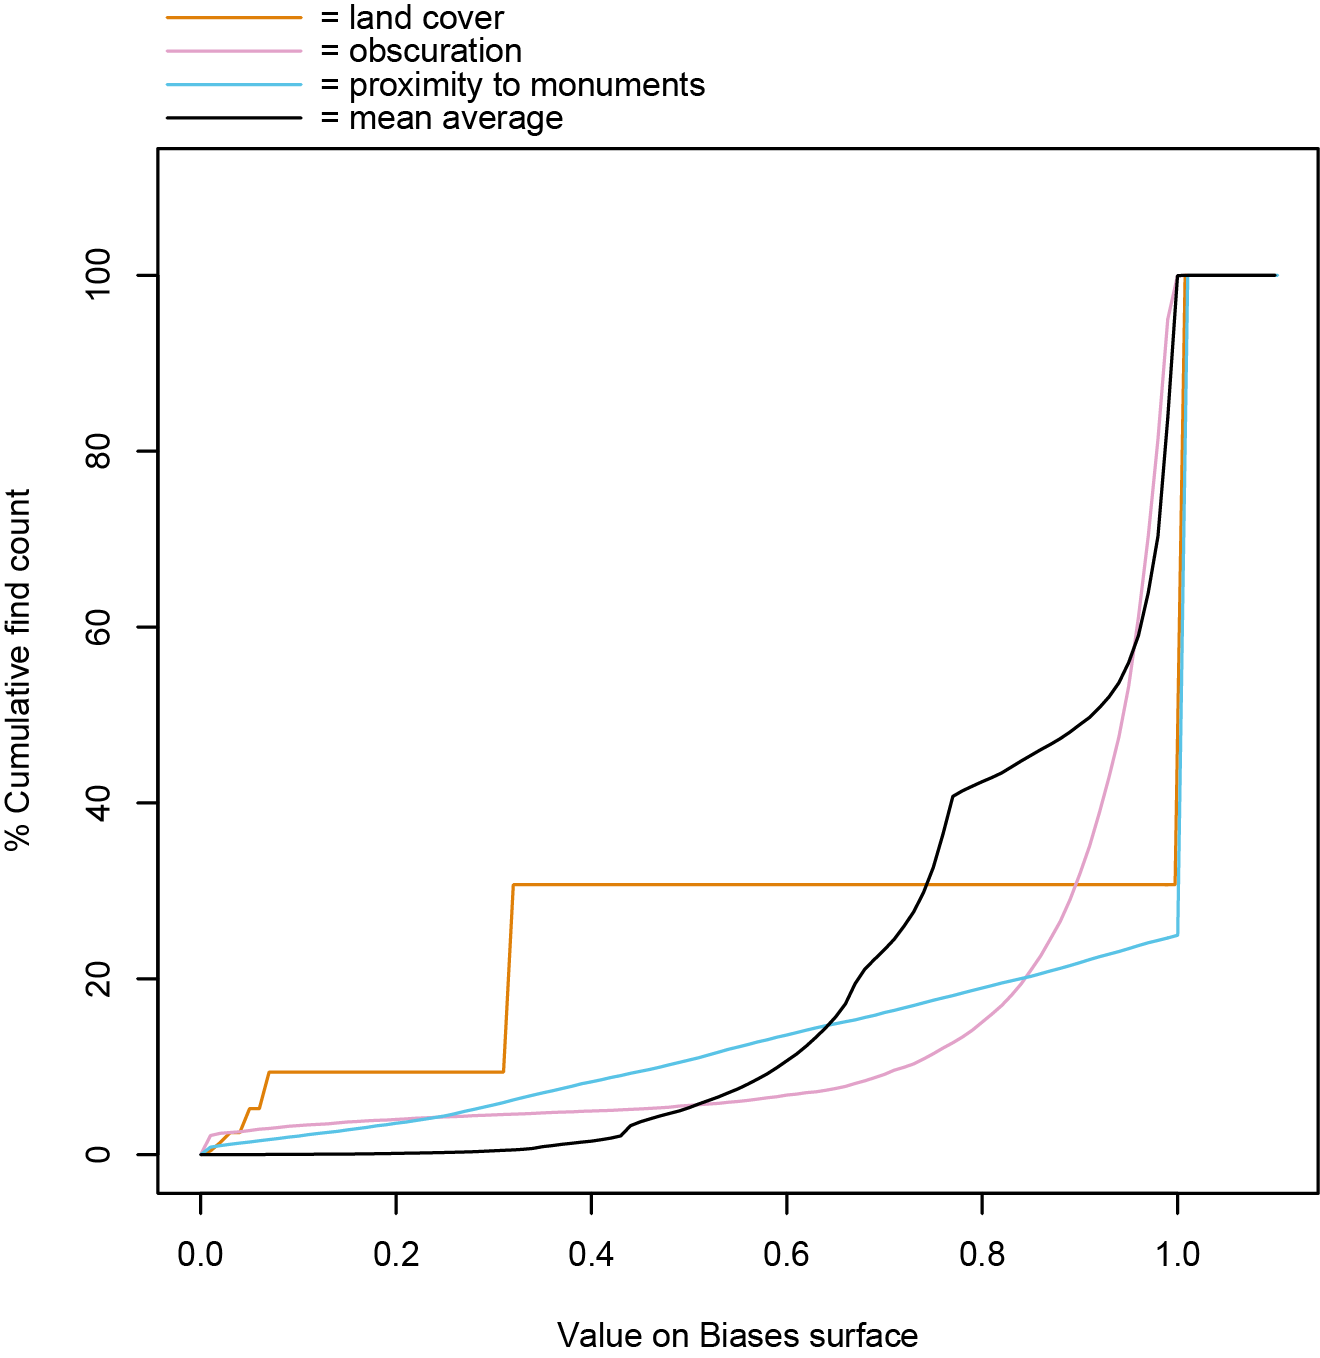
Figure 3: Graph comparing percentage of PAS findspots against the three affordance models and the combined model
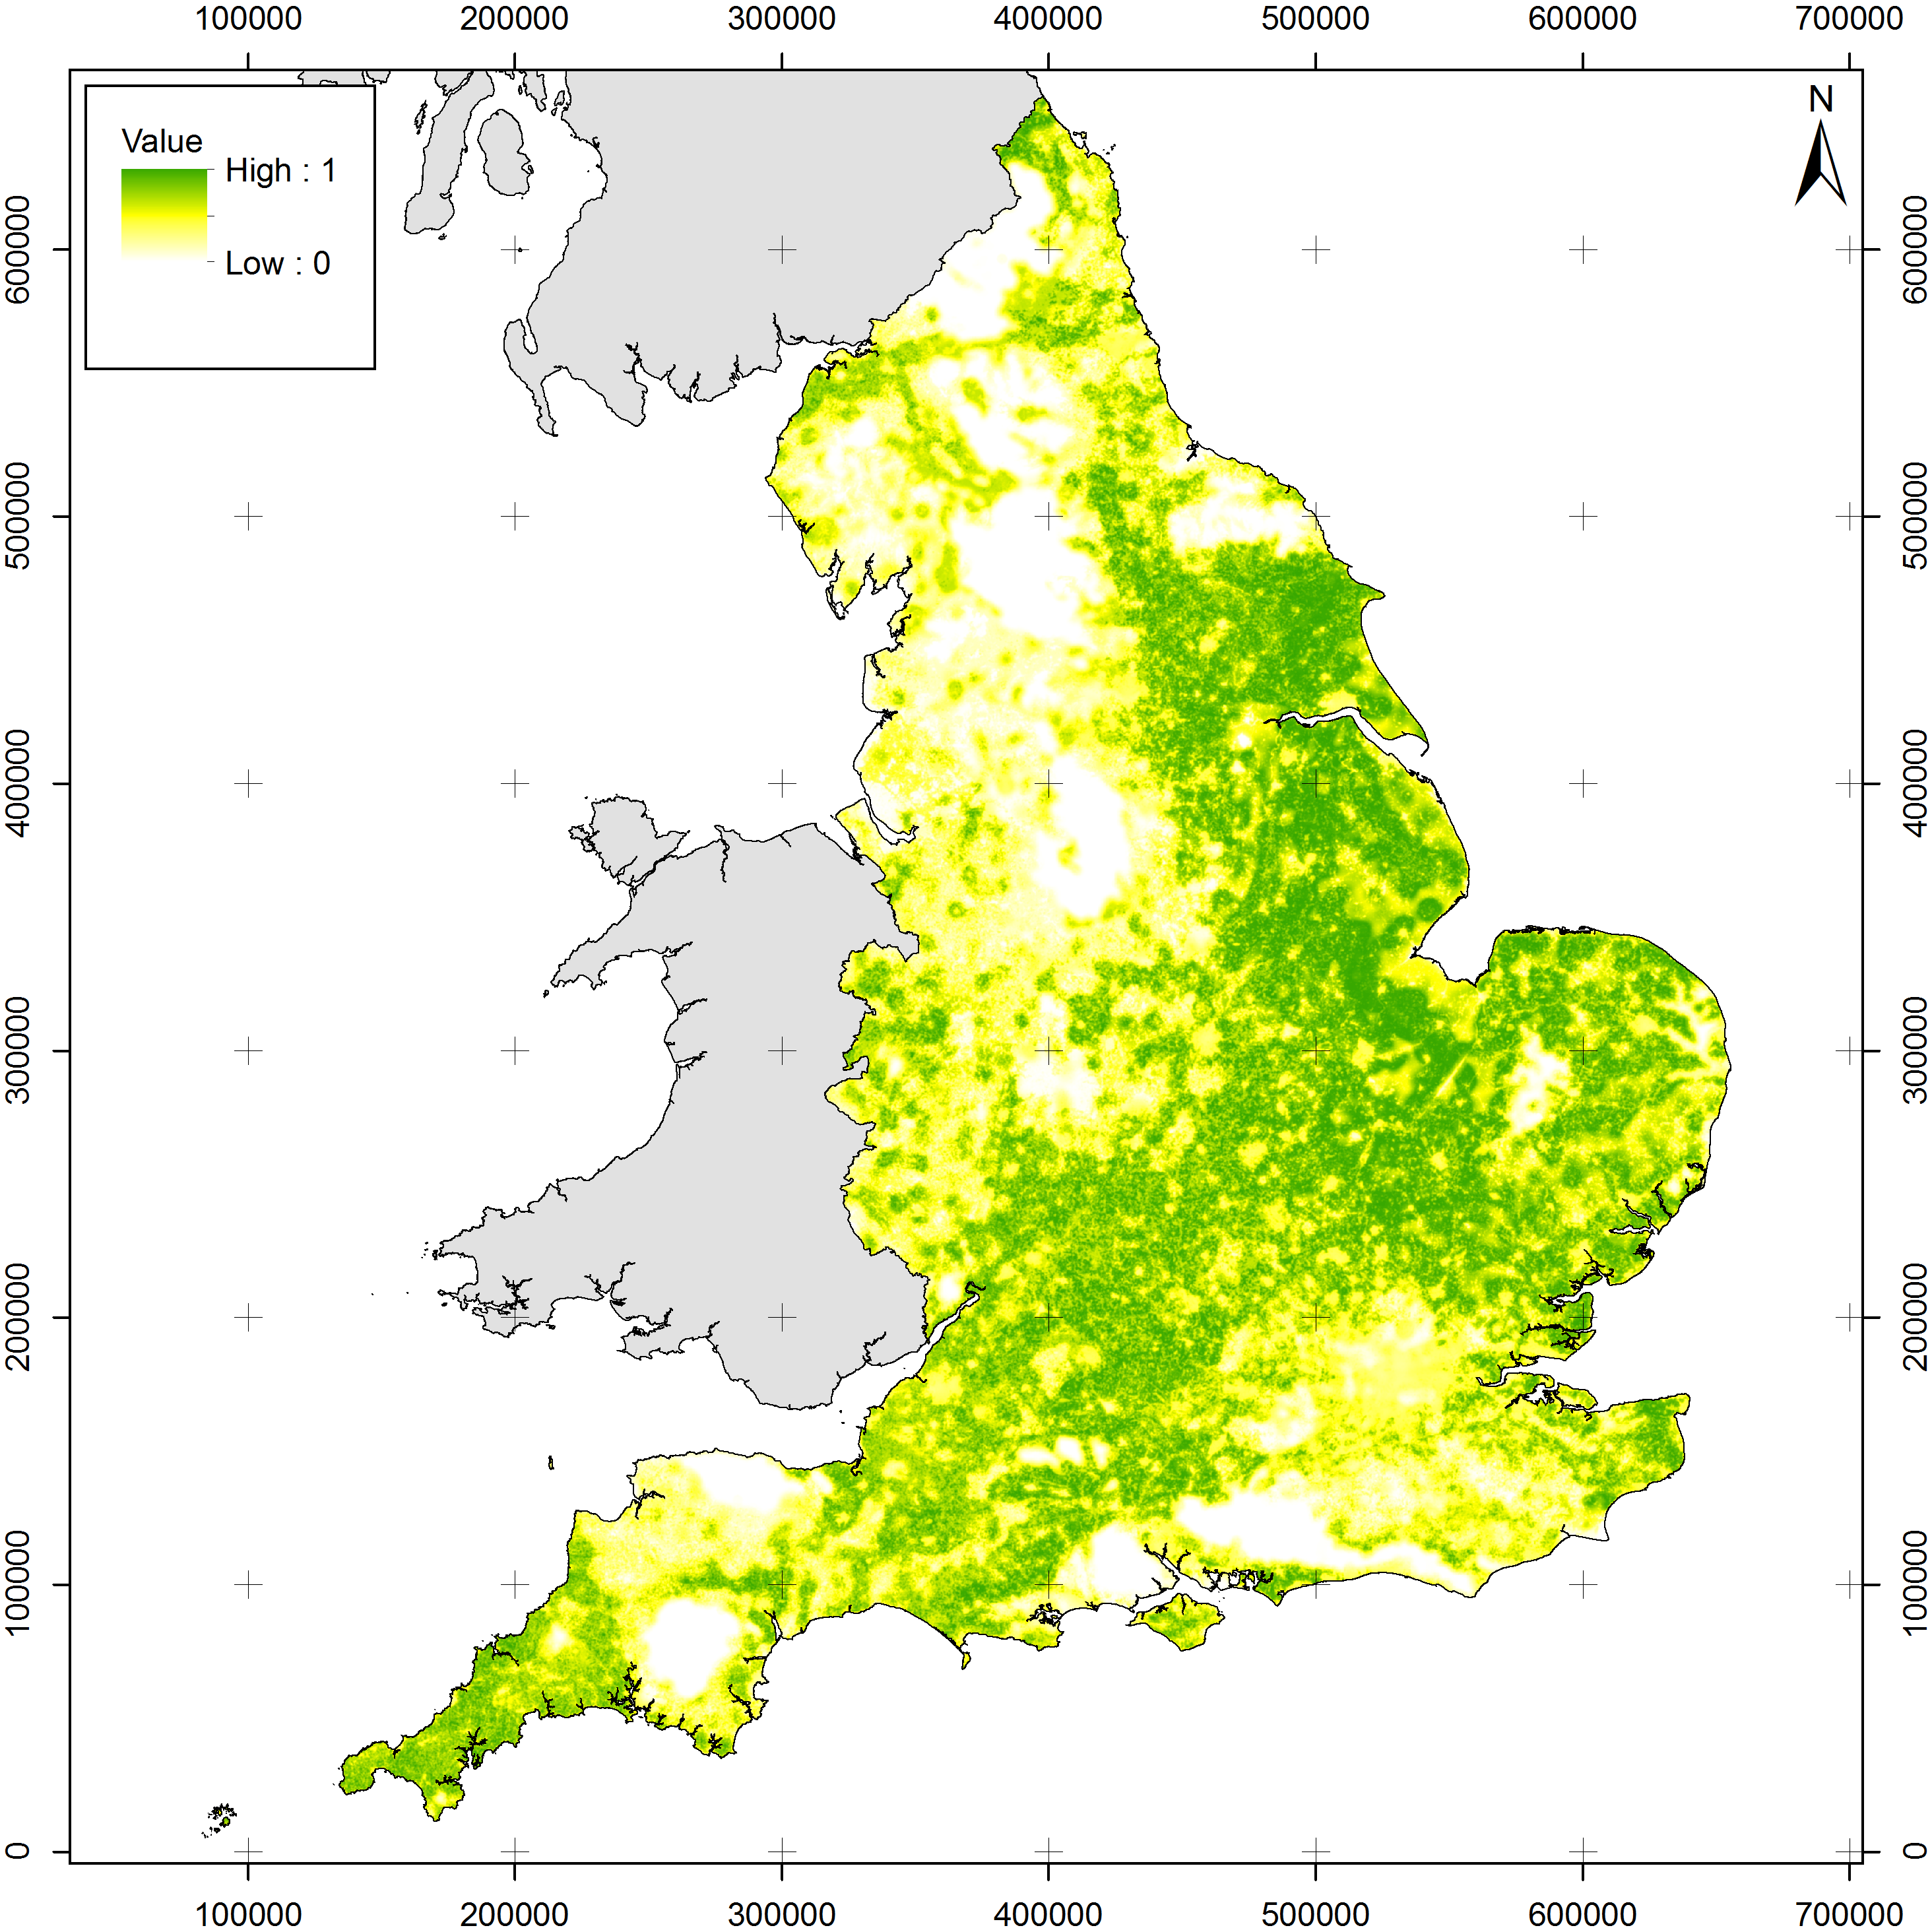
Figure 4: Combined affordance model for PAS finds in England
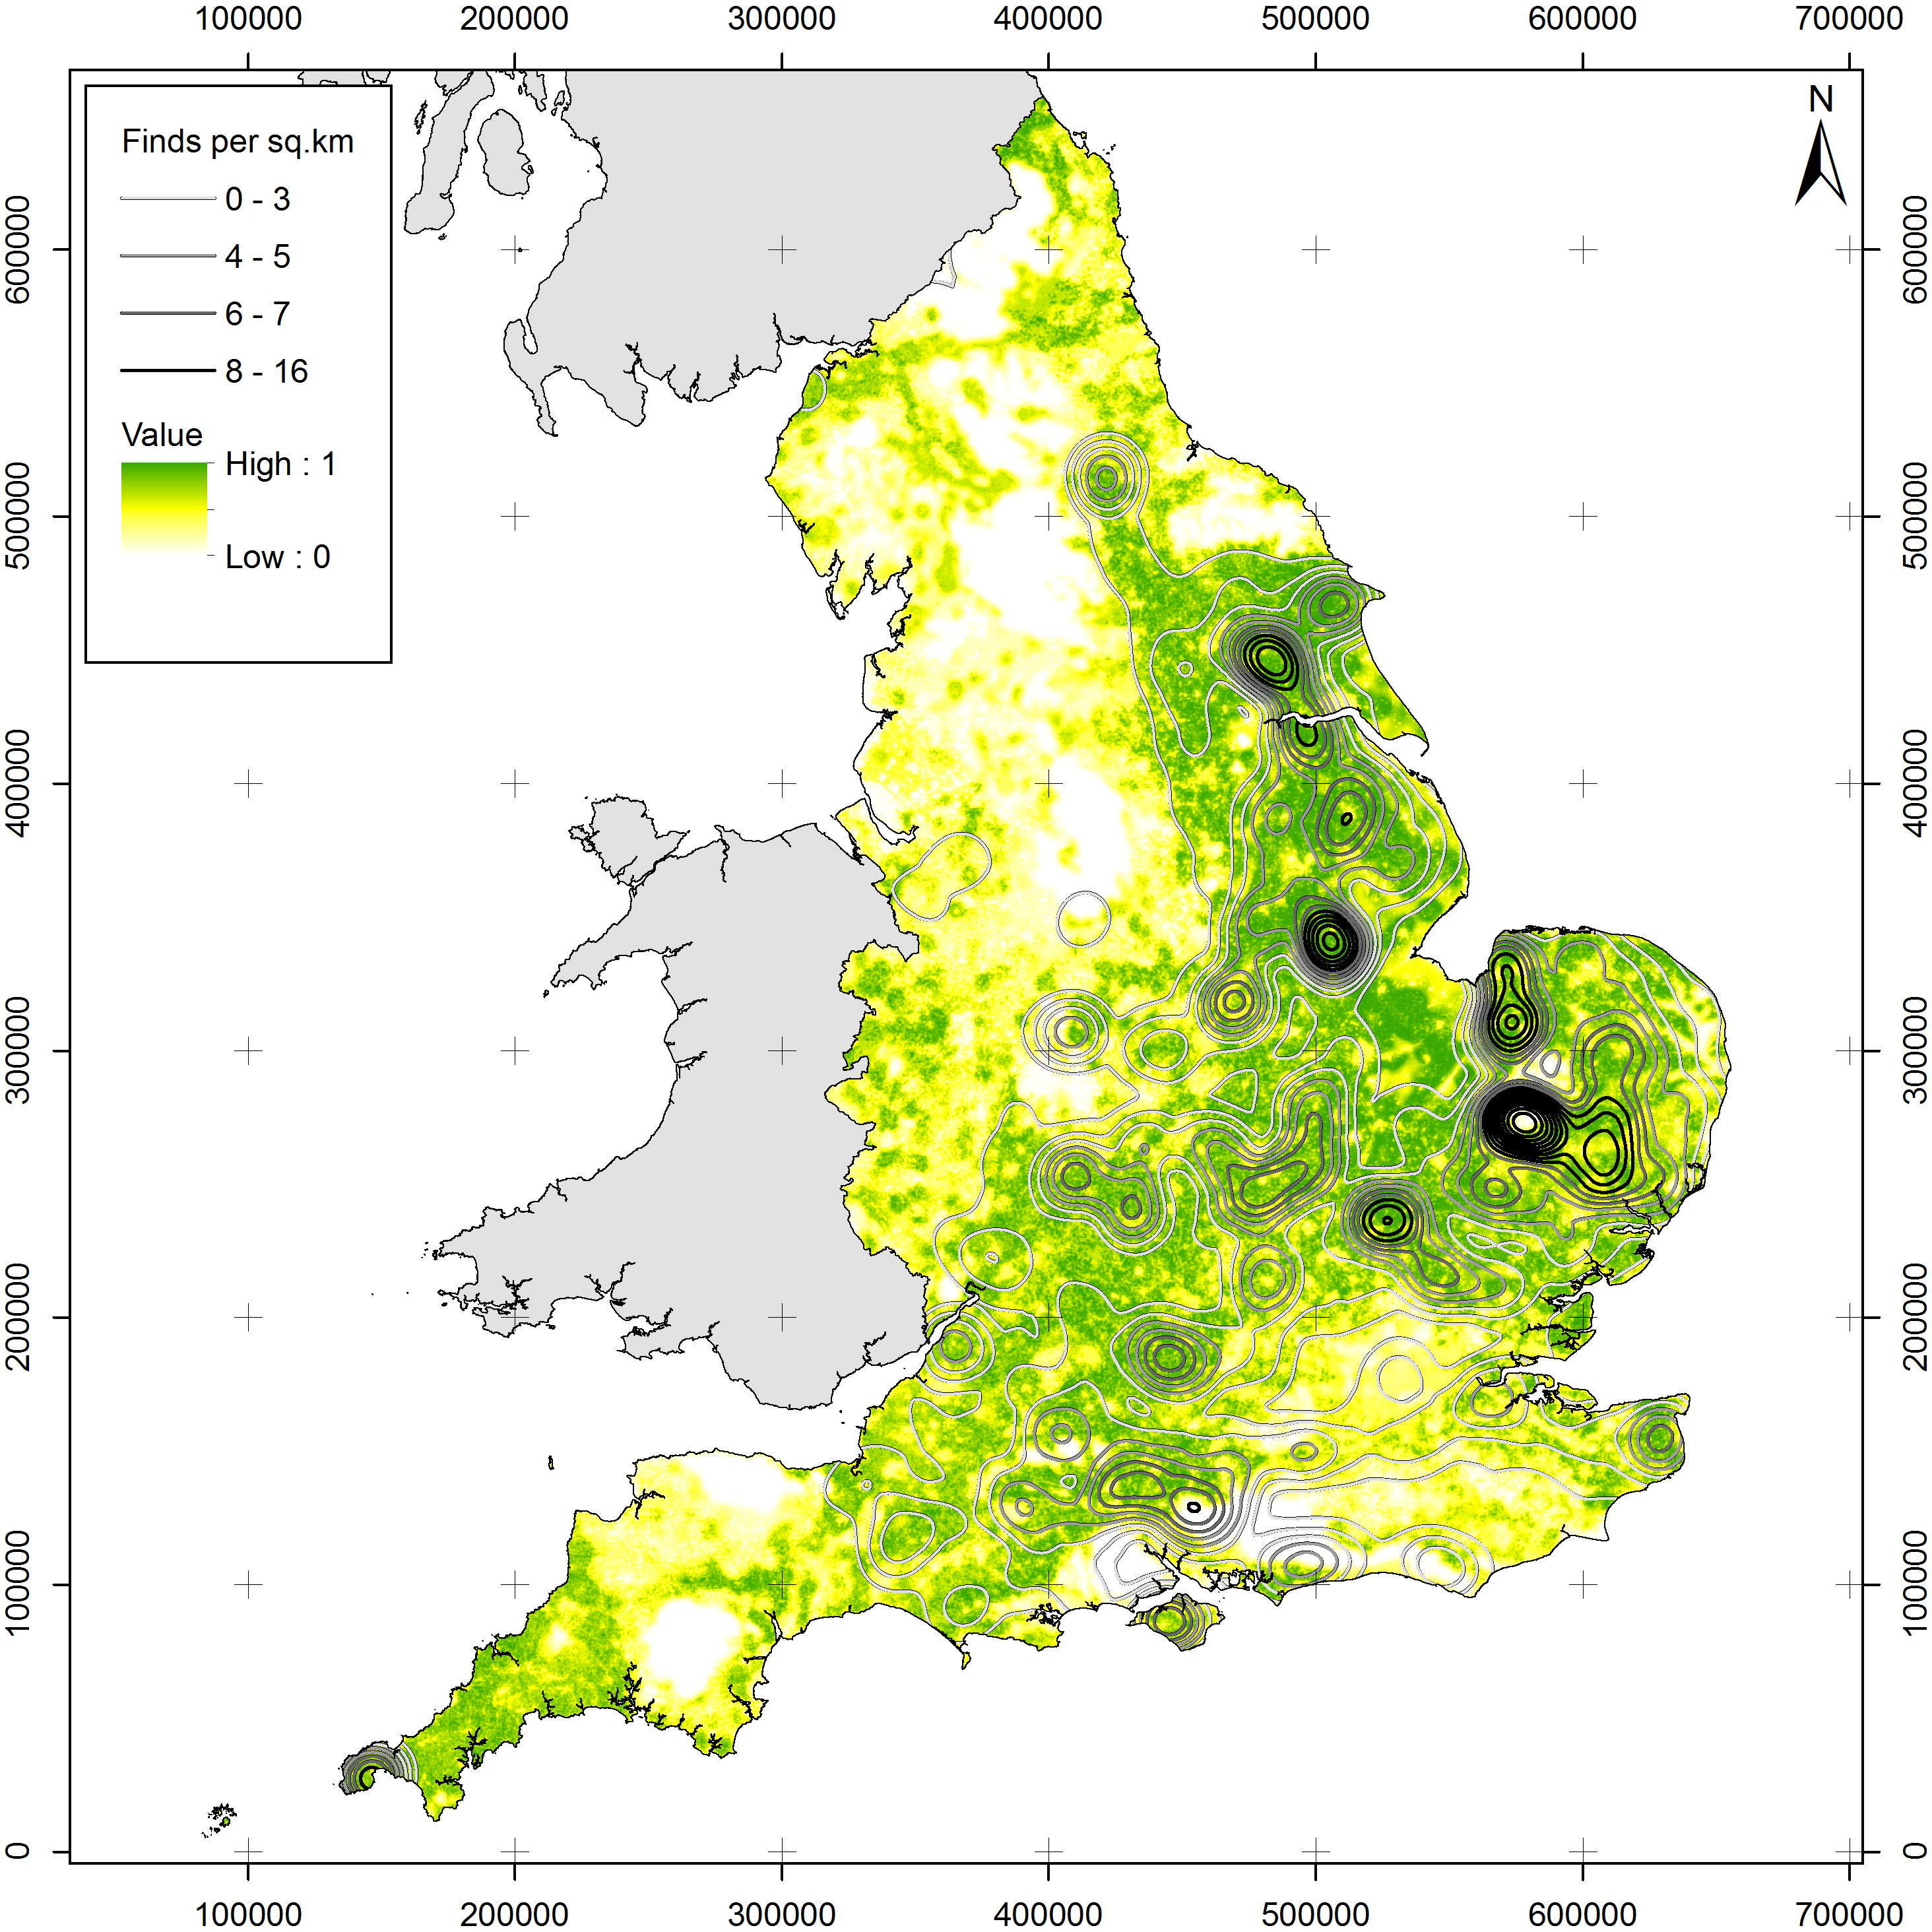
Figure 5: Combined affordance model for PAS finds in England overlain with contours created from a (20km kernel) KDE plot of the distribution PAS finds dating to the period 1500 BC–AD 1086
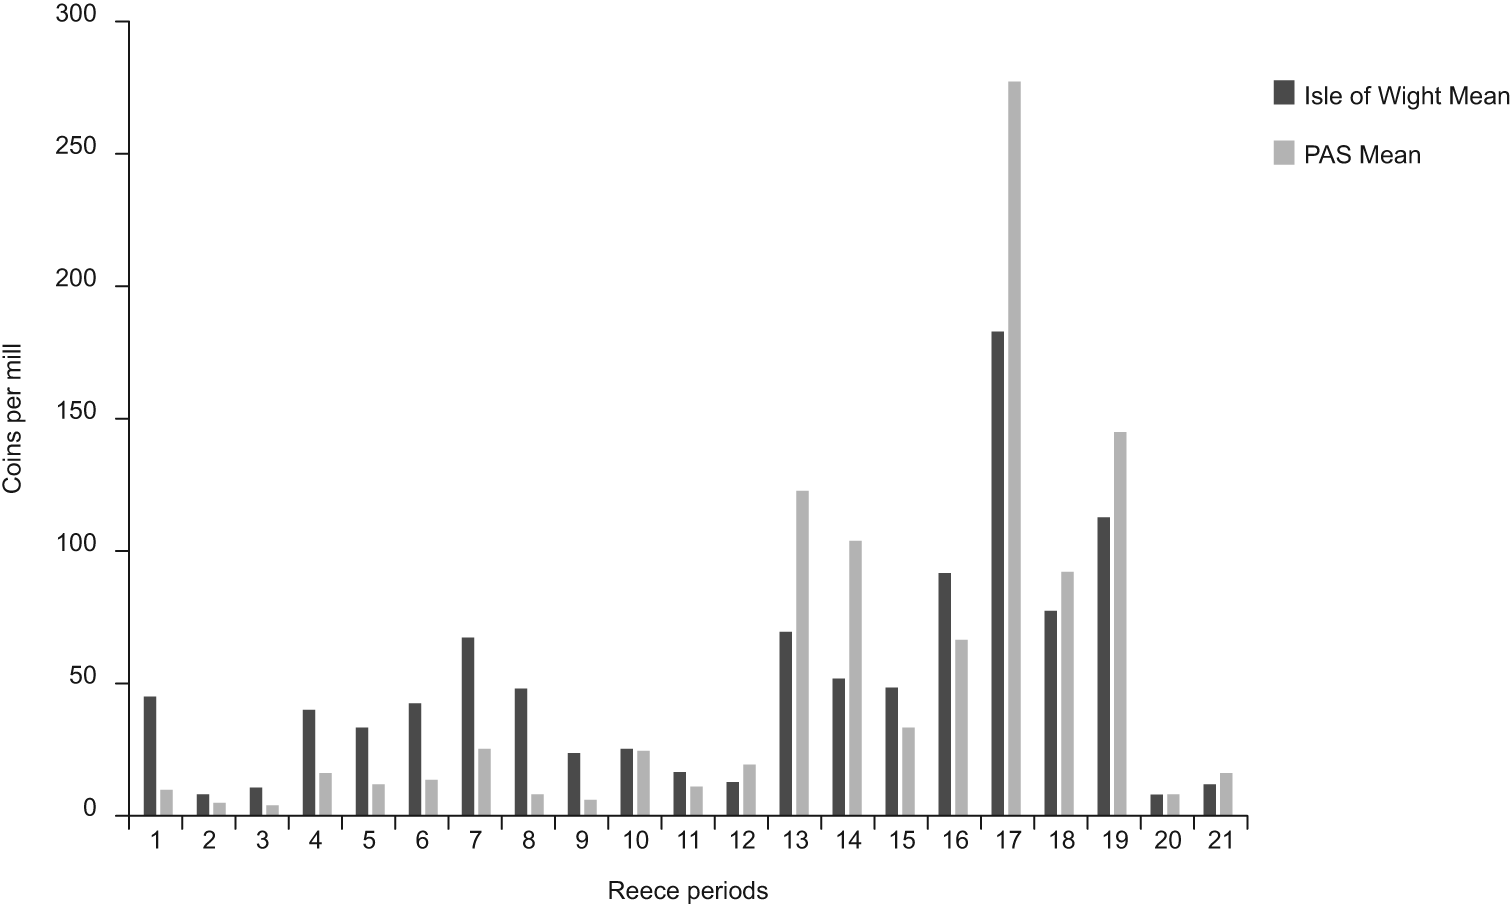
Figure 6: Comparison of the tempo of Roman coin loss at a national level (PAS mean) and on the Isle of Wight (Isle of Wight mean) using Reece periods (following Walton 2012, 120)
Figure 7: Collated probabilities of PAS find dates from 1500 BC–AD 1086 using fuzzy time-slices, weighted by artefact quantities
Figure 8: Comparison of all PAS coin finds from 1500 BC–AD 1086 (material from hoards and from isolated finds): (a) comparing traditional coin periods and fuzzy time-slices for England; (b) the same for the Isle of Wight; (c) comparing finds from hoards and single coin finds using fuzzy time-slices for the Isle of Wight
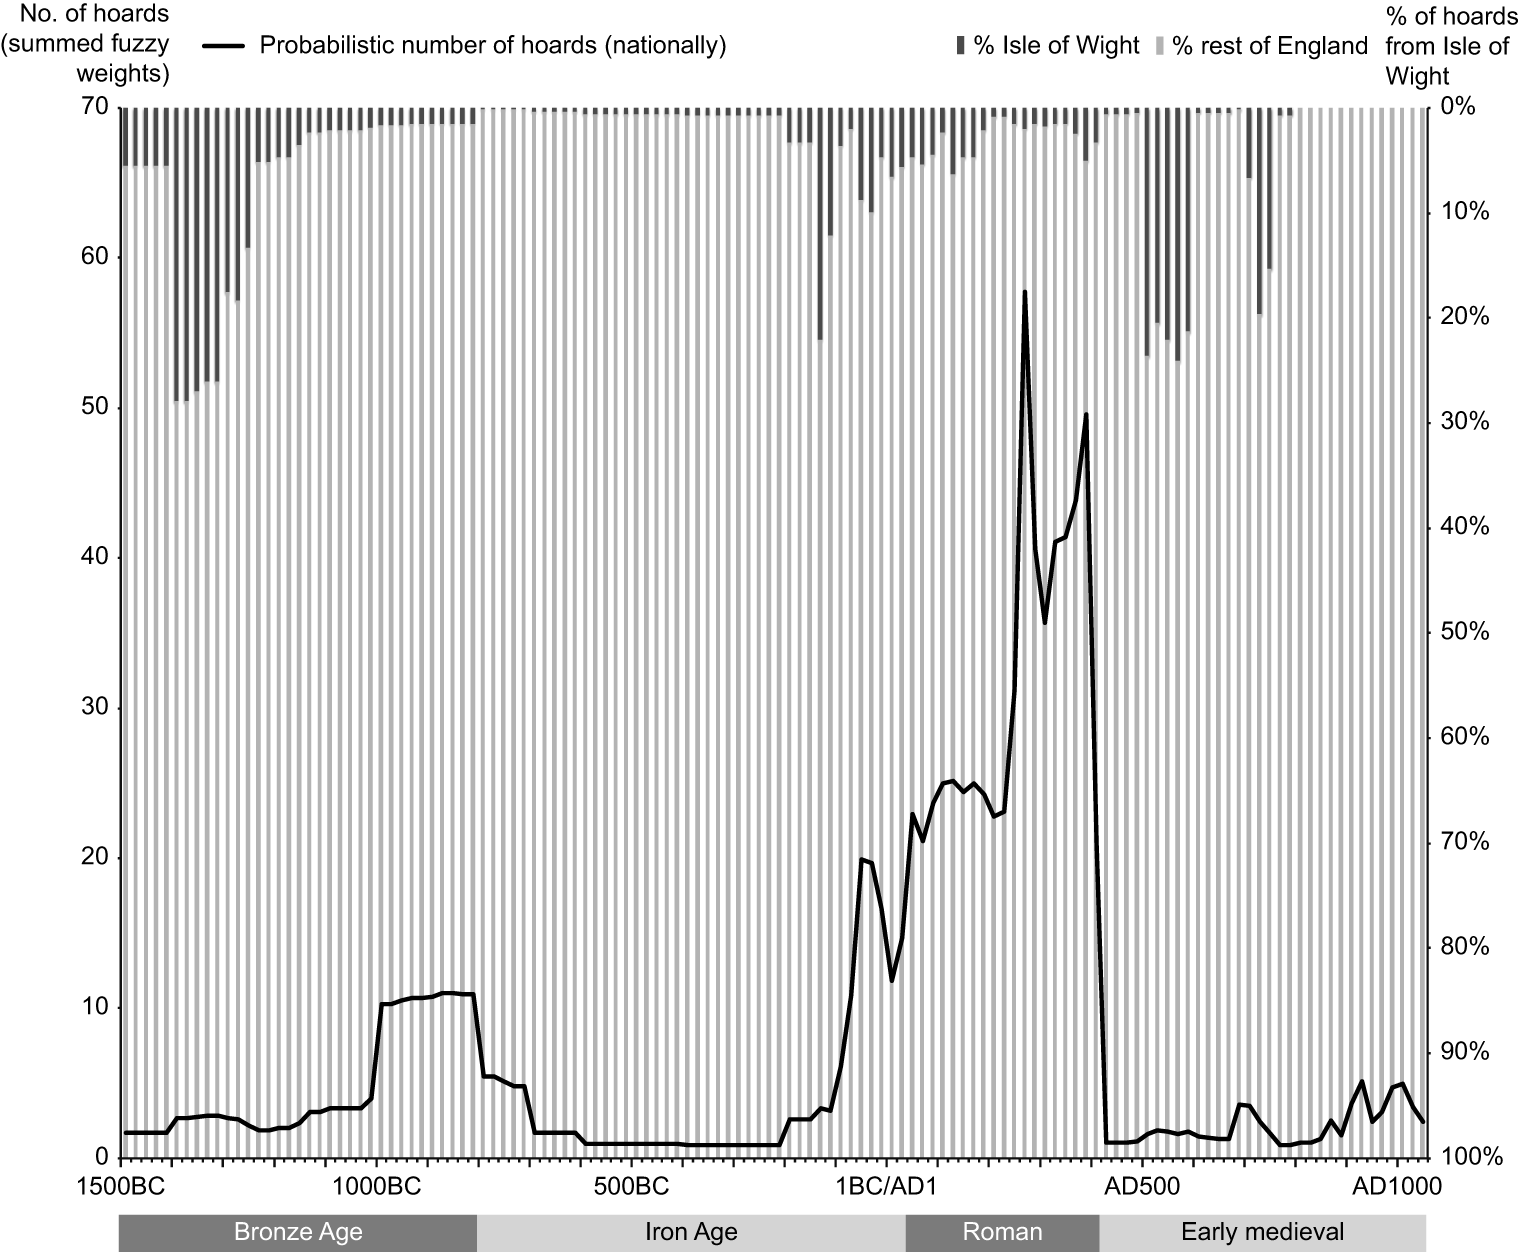
Figure 9: Hoards (including materials of all kinds) through time using 20-year fuzzy time-slices, showing: (a) probable number of hoards at a national level (black line; left y-axis); (b) hoards from the Isle of Wight as a percentage of the national figure (shaded columns; right y-axis). Because of the fuzzy approach used, the national level pattern of deposition is a composite weighting and should not be read as the absolute number of hoards within any time-slice, but more as the weighted probable number of hoards
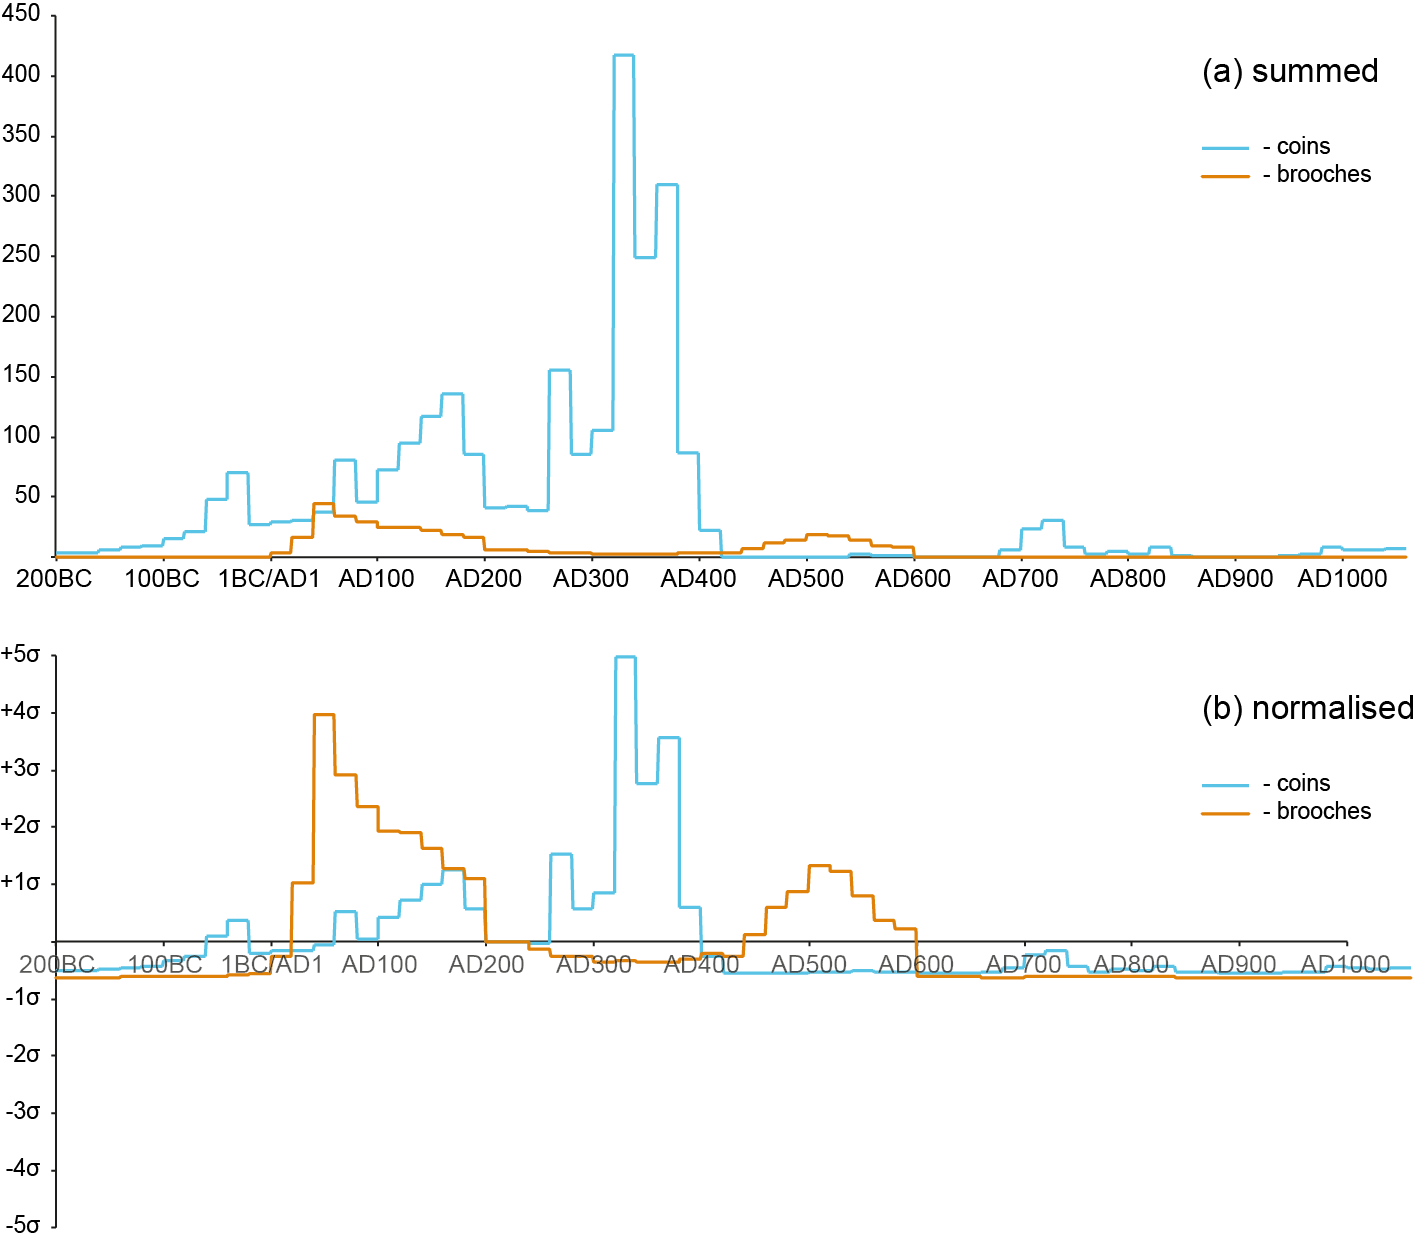
Figure 10: Comparison of temporal patterning in PAS (single) coin and brooch finds for the Isle of Wight using fuzzy time-slices: (a) summed total probabilities multiplied by finds quantity; (b) as (a) but normalised by mean and standard deviation (z-score) for easier visual comparison (positive values are in standard deviations above the mean, negative values below)
Figure 11: Summary of 'site' definition methodology
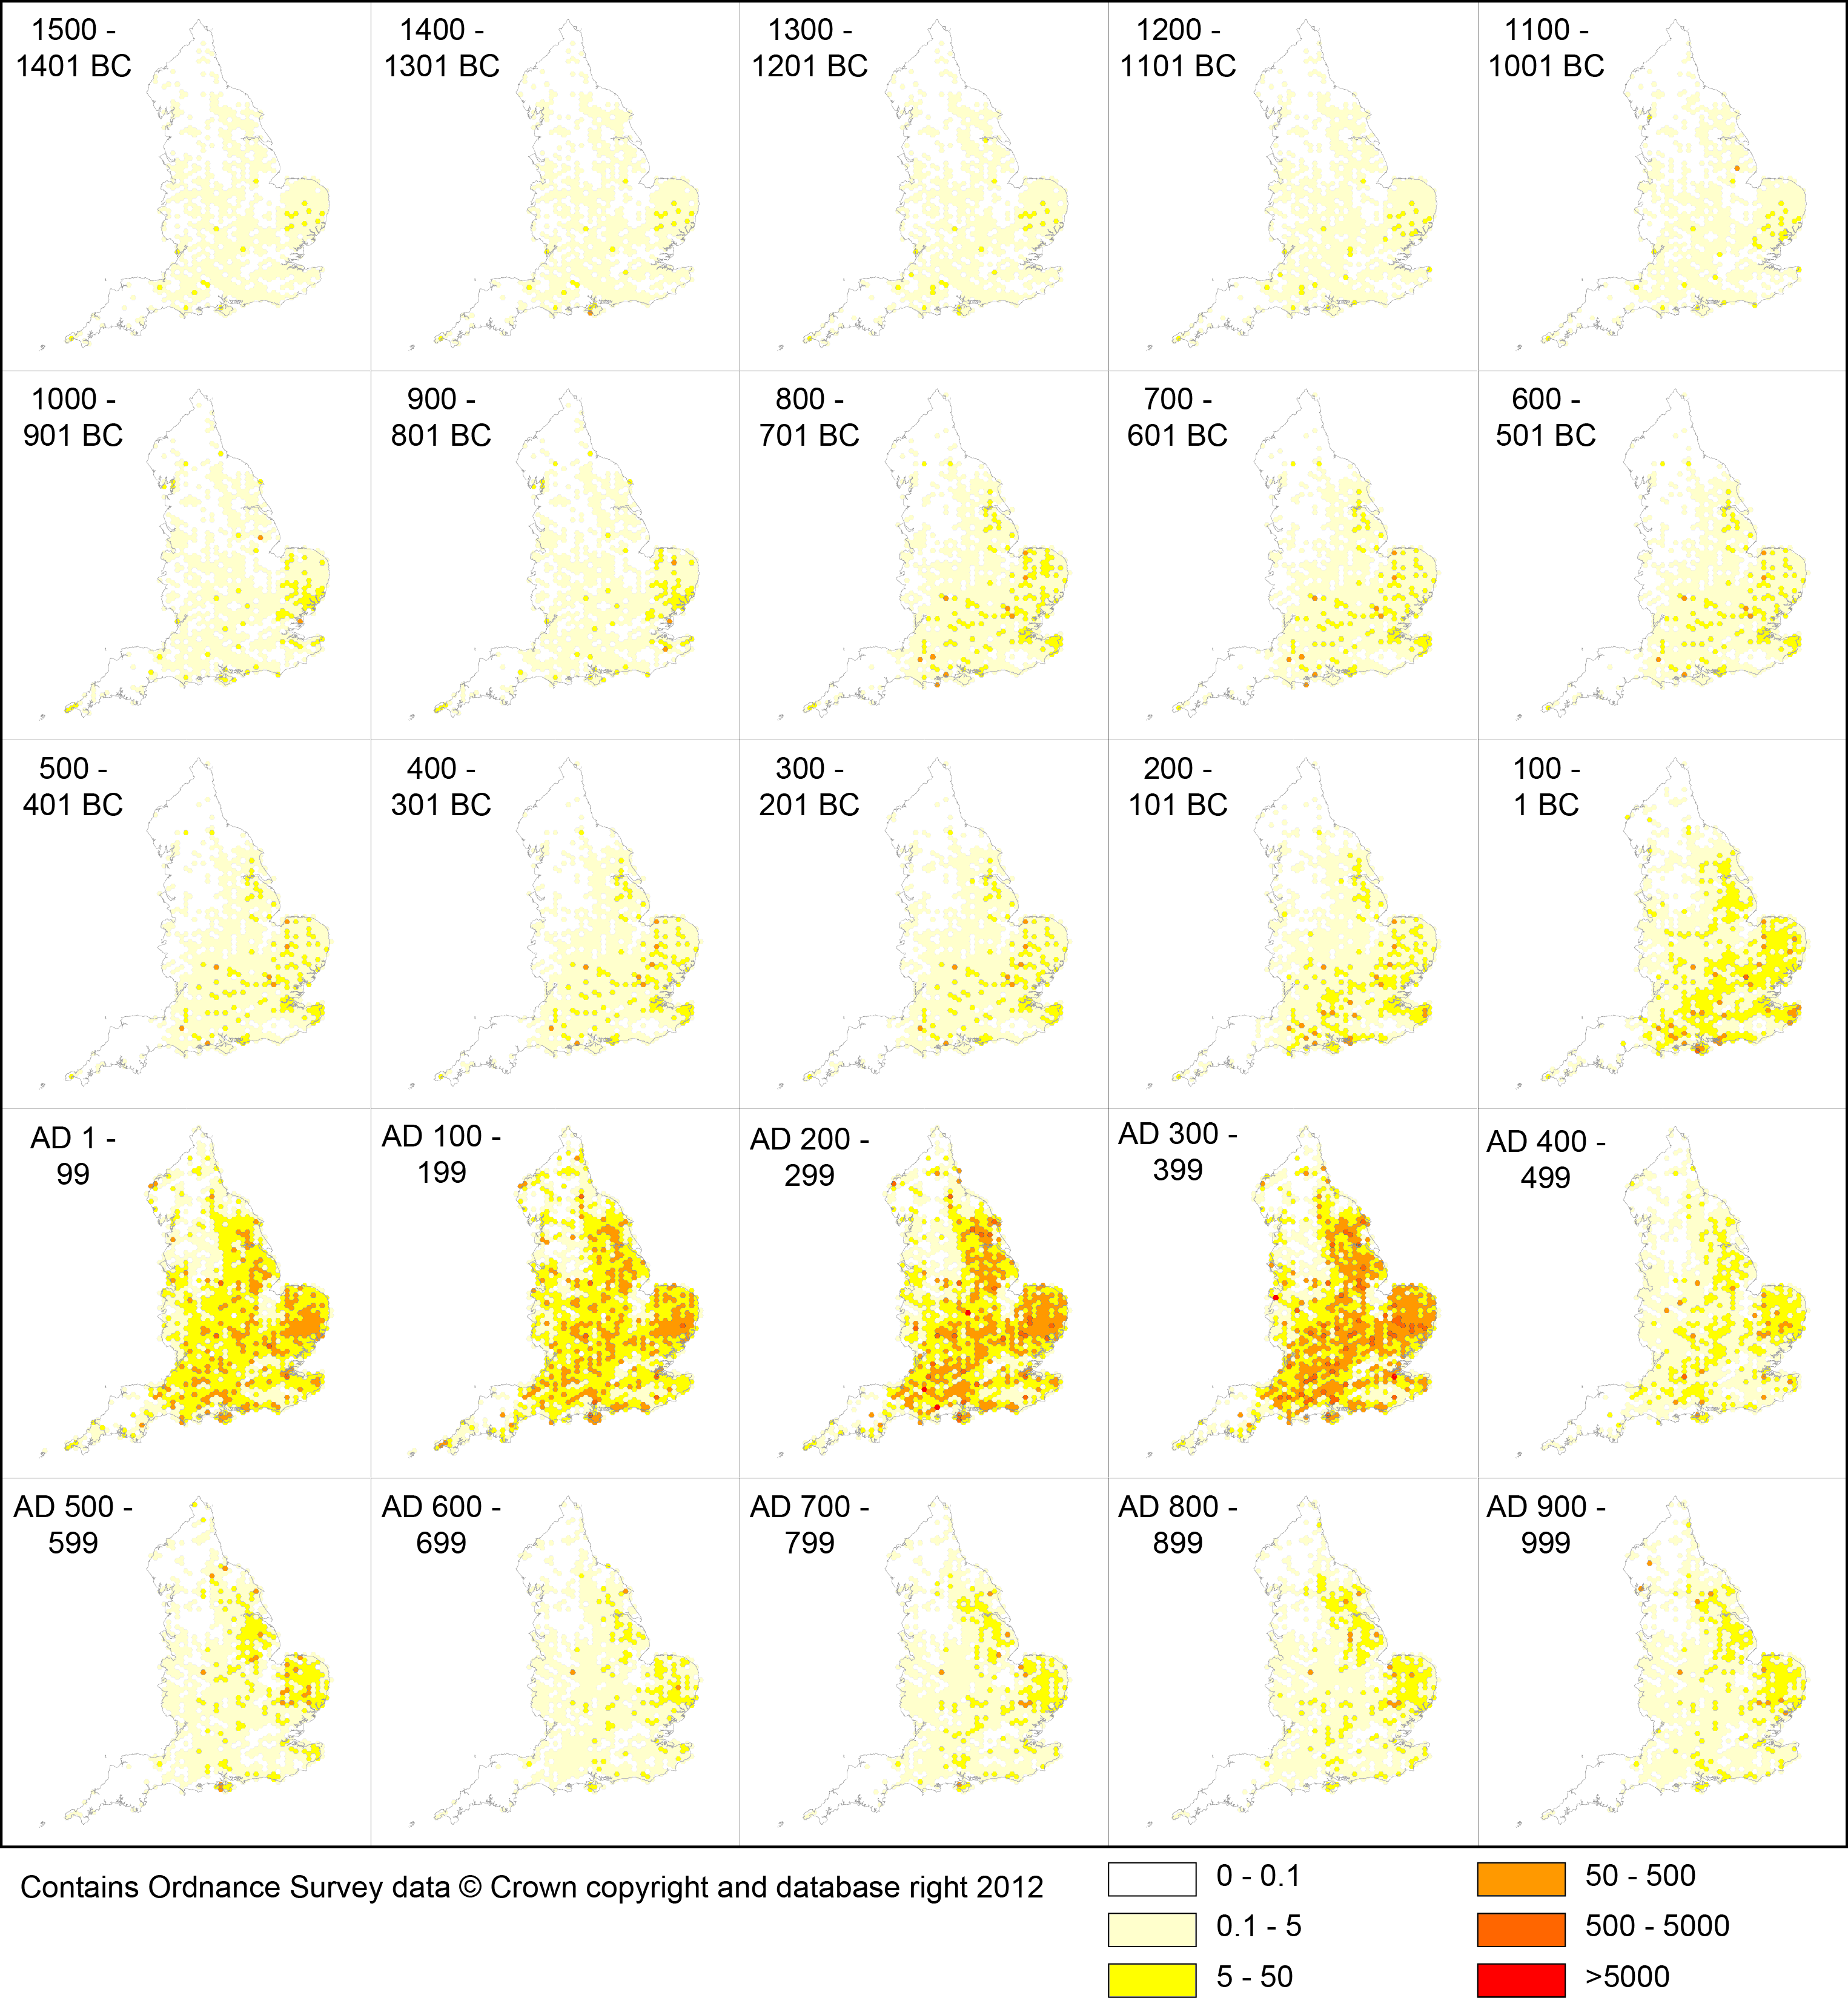
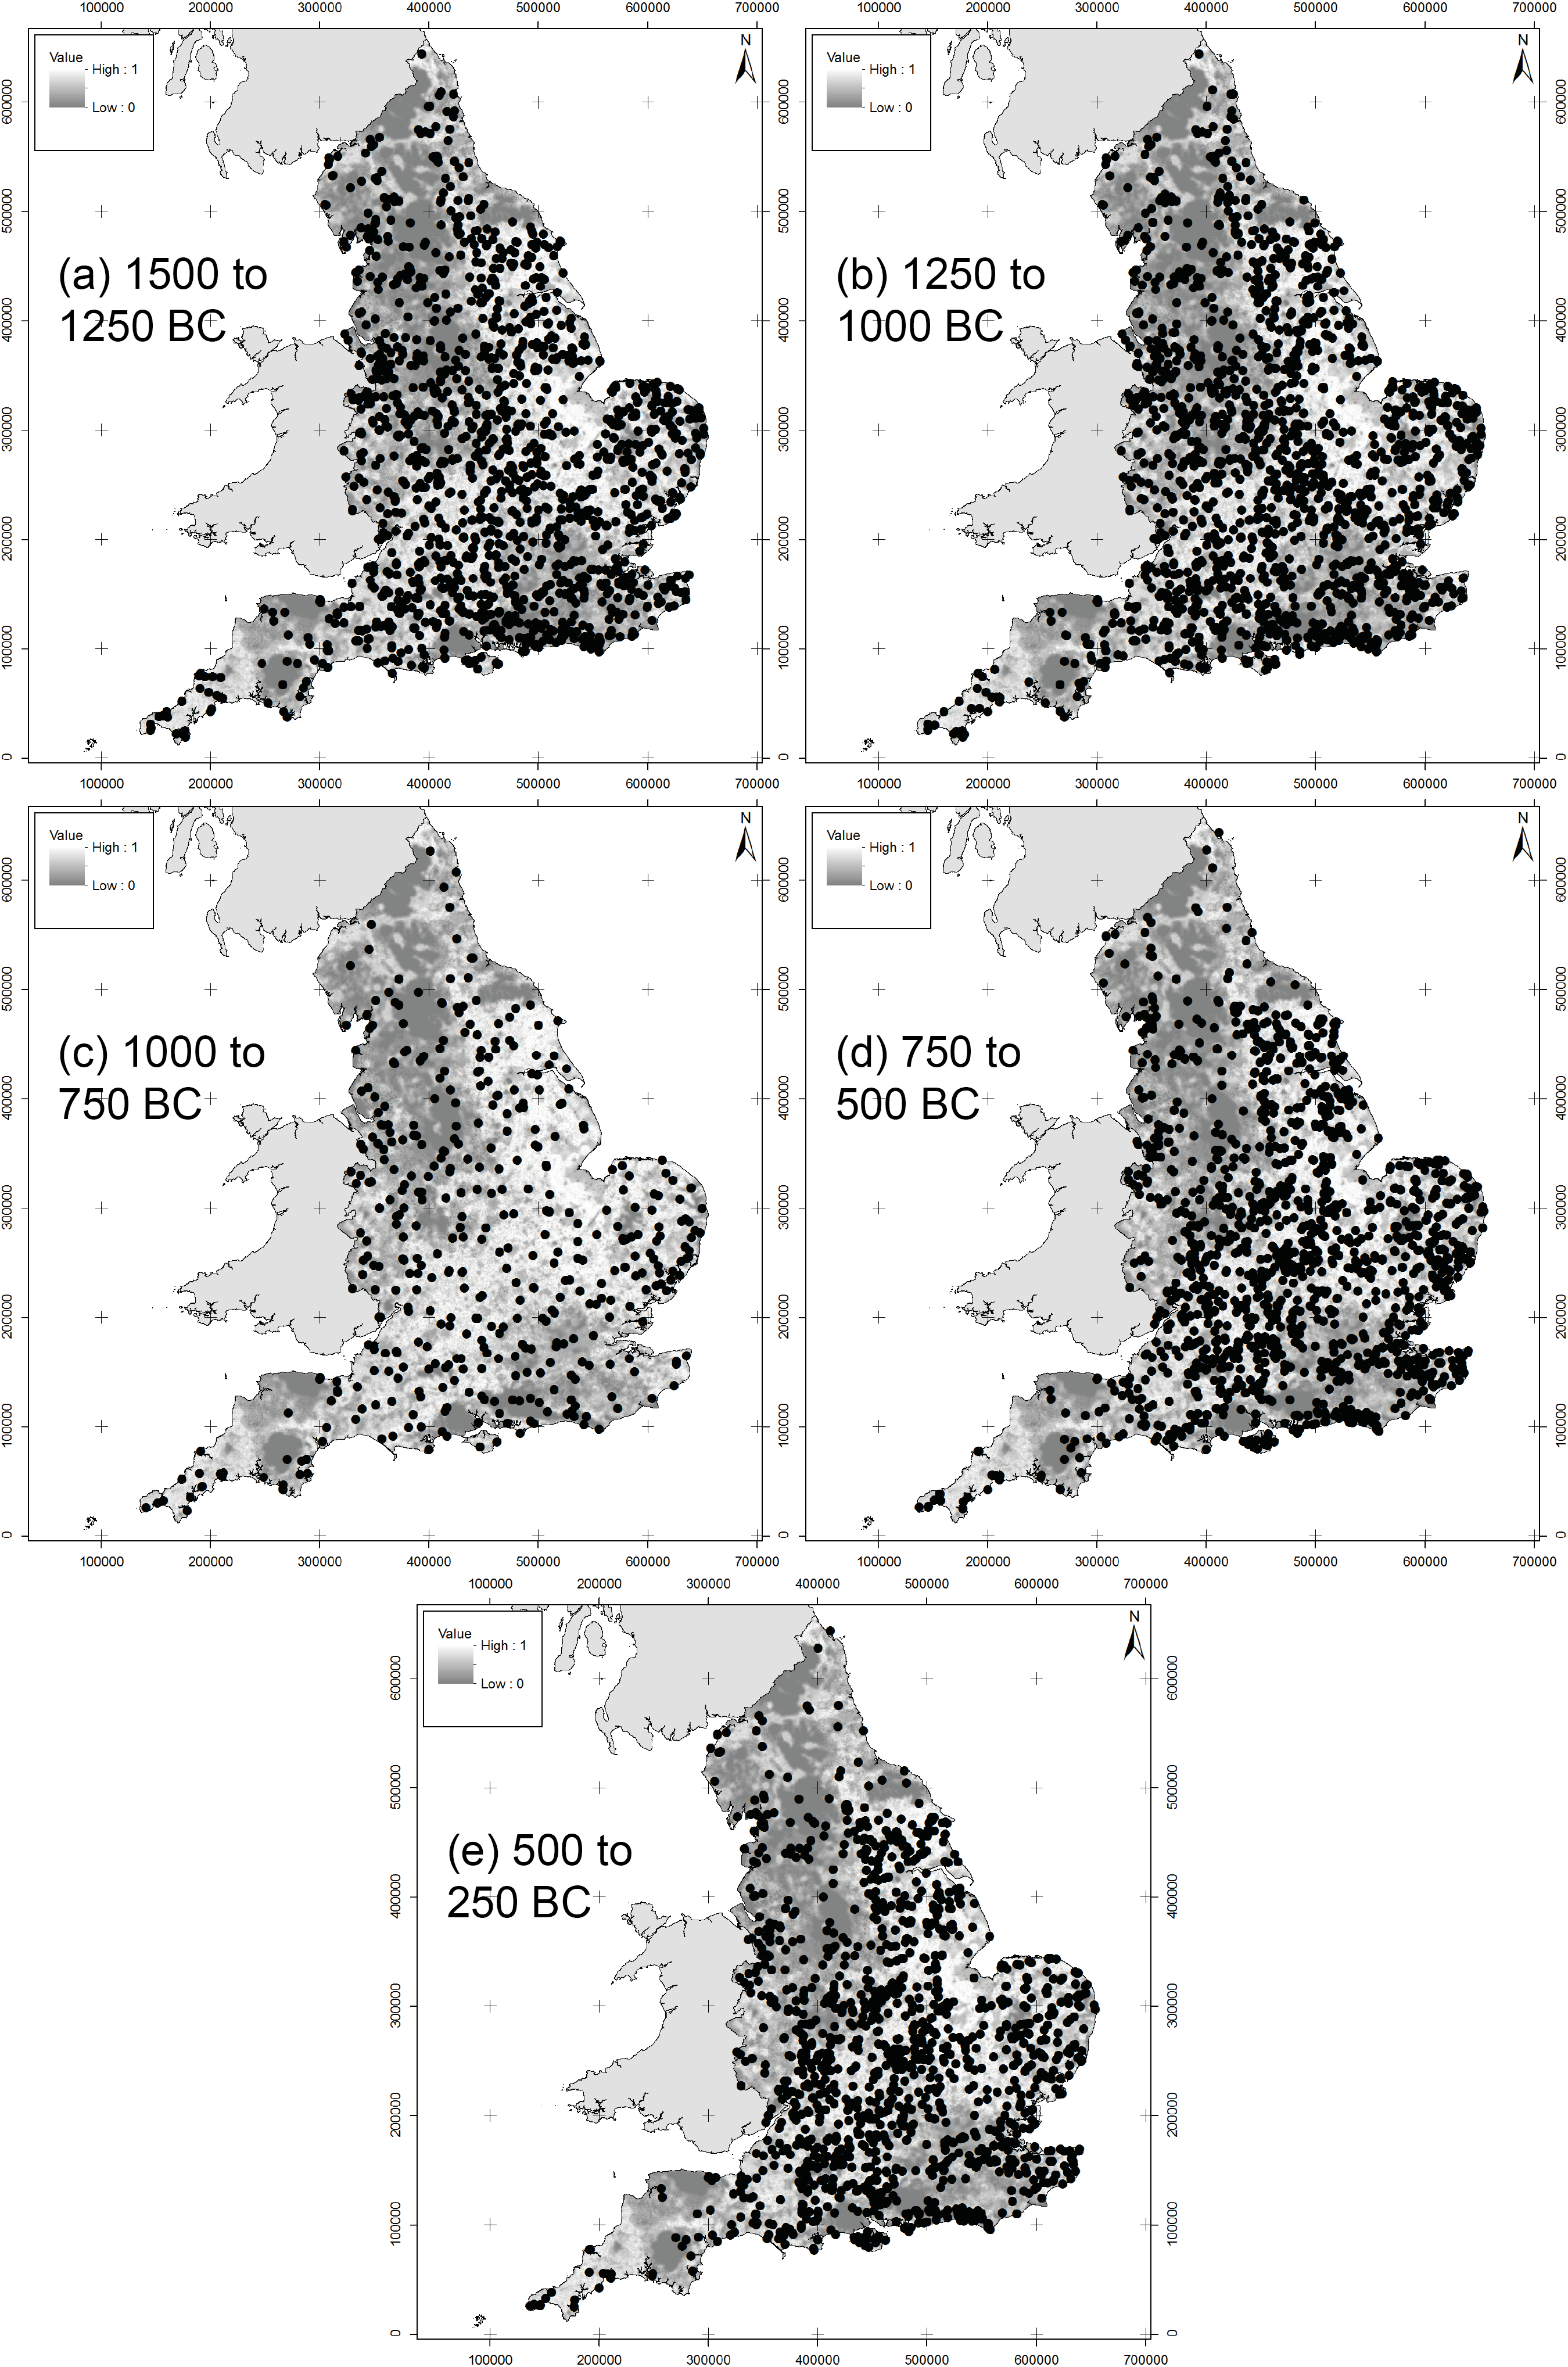
Figure 12 a-e and f-j: Potentially significant concentrations of material or 'sites' organised by 250-year time-slices from 1500 BC–AD 1000
Internet Archaeology is an open access journal based in the Department of Archaeology, University of York. Except where otherwise noted, content from this work may be used under the terms of the Creative Commons Attribution 3.0 (CC BY) Unported licence, which permits unrestricted use, distribution, and reproduction in any medium, provided that attribution to the author(s), the title of the work, the Internet Archaeology journal and the relevant URL/DOI are given.
Terms and Conditions | Legal Statements | Privacy Policy | Cookies Policy | Citing Internet Archaeology
Internet Archaeology content is preserved for the long term with the Archaeology Data Service. Help sustain and support open access publication by donating to our Open Access Archaeology Fund.