Cite this as: Mees, A. 2018 Was there a Difference between Roman 'Civil' and 'Military' Samian (terra sigillata) Market Supply? Finding answers with statistical distribution analysis methods, Internet Archaeology 50. https://doi.org/10.11141/ia.50.16
The Roman samian (terra sigillata) pottery industry achieved a market penetration that completely covered the north-west and western Mediterranean parts of the Roman Empire.
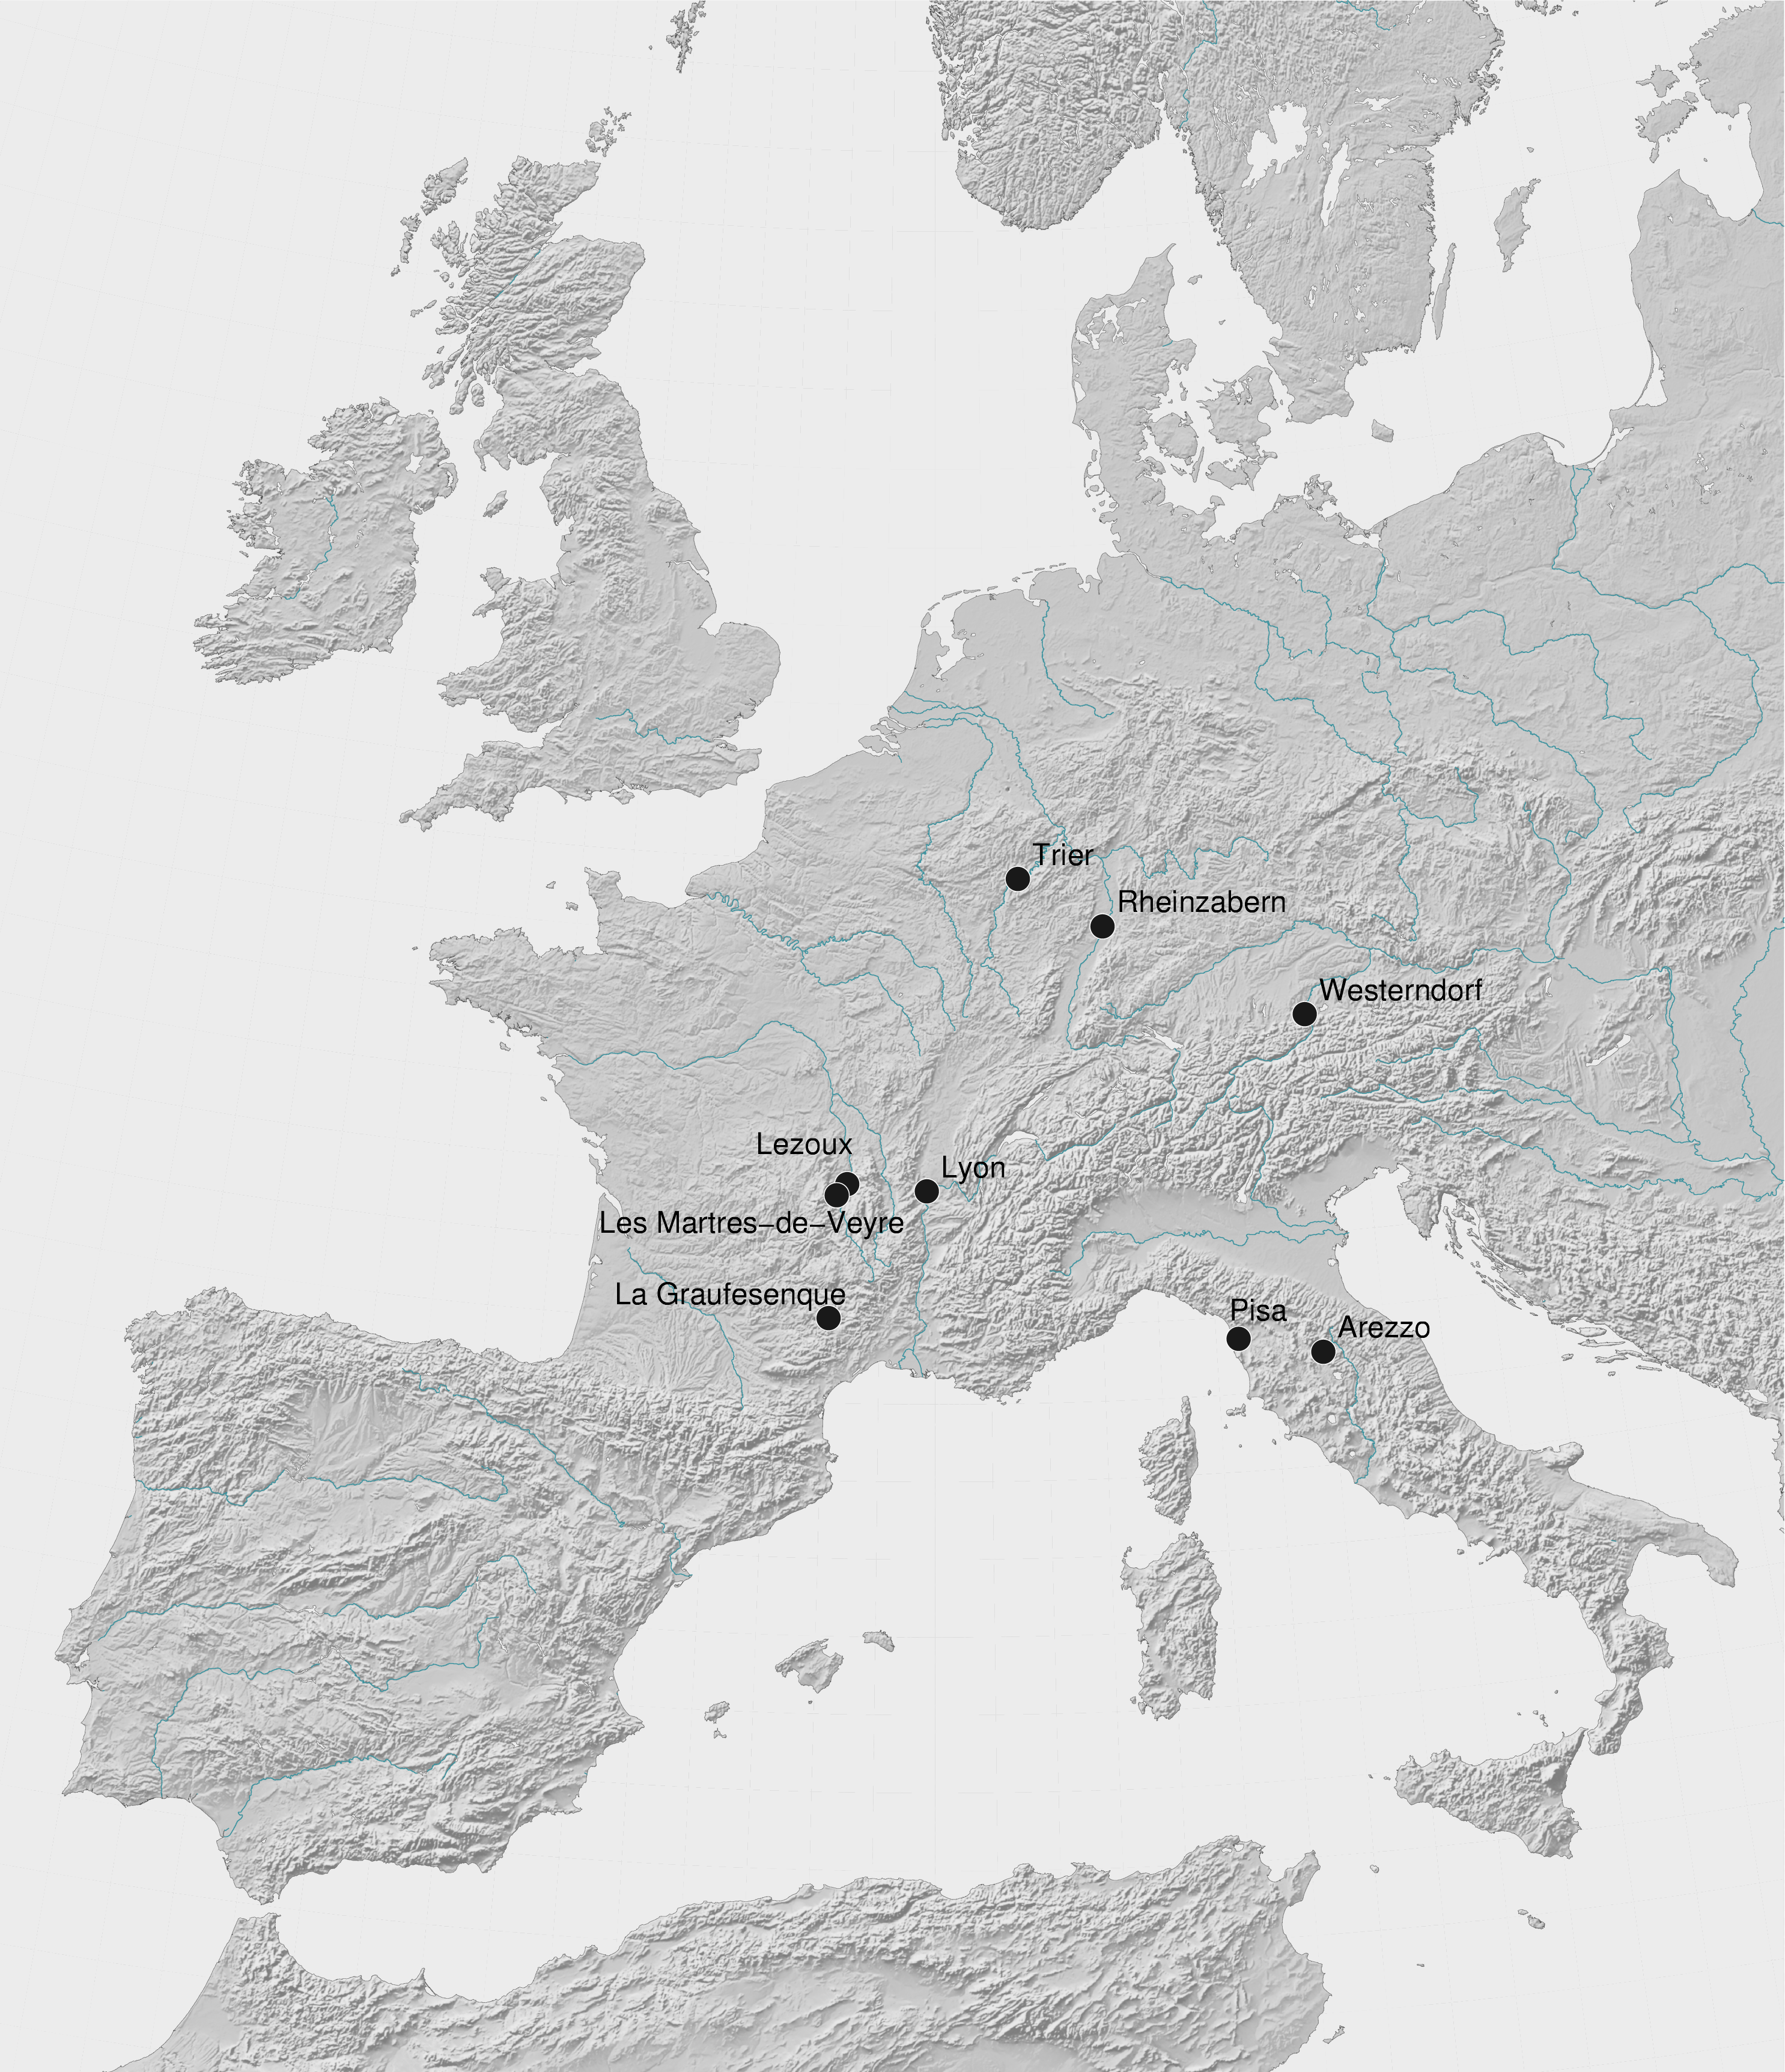
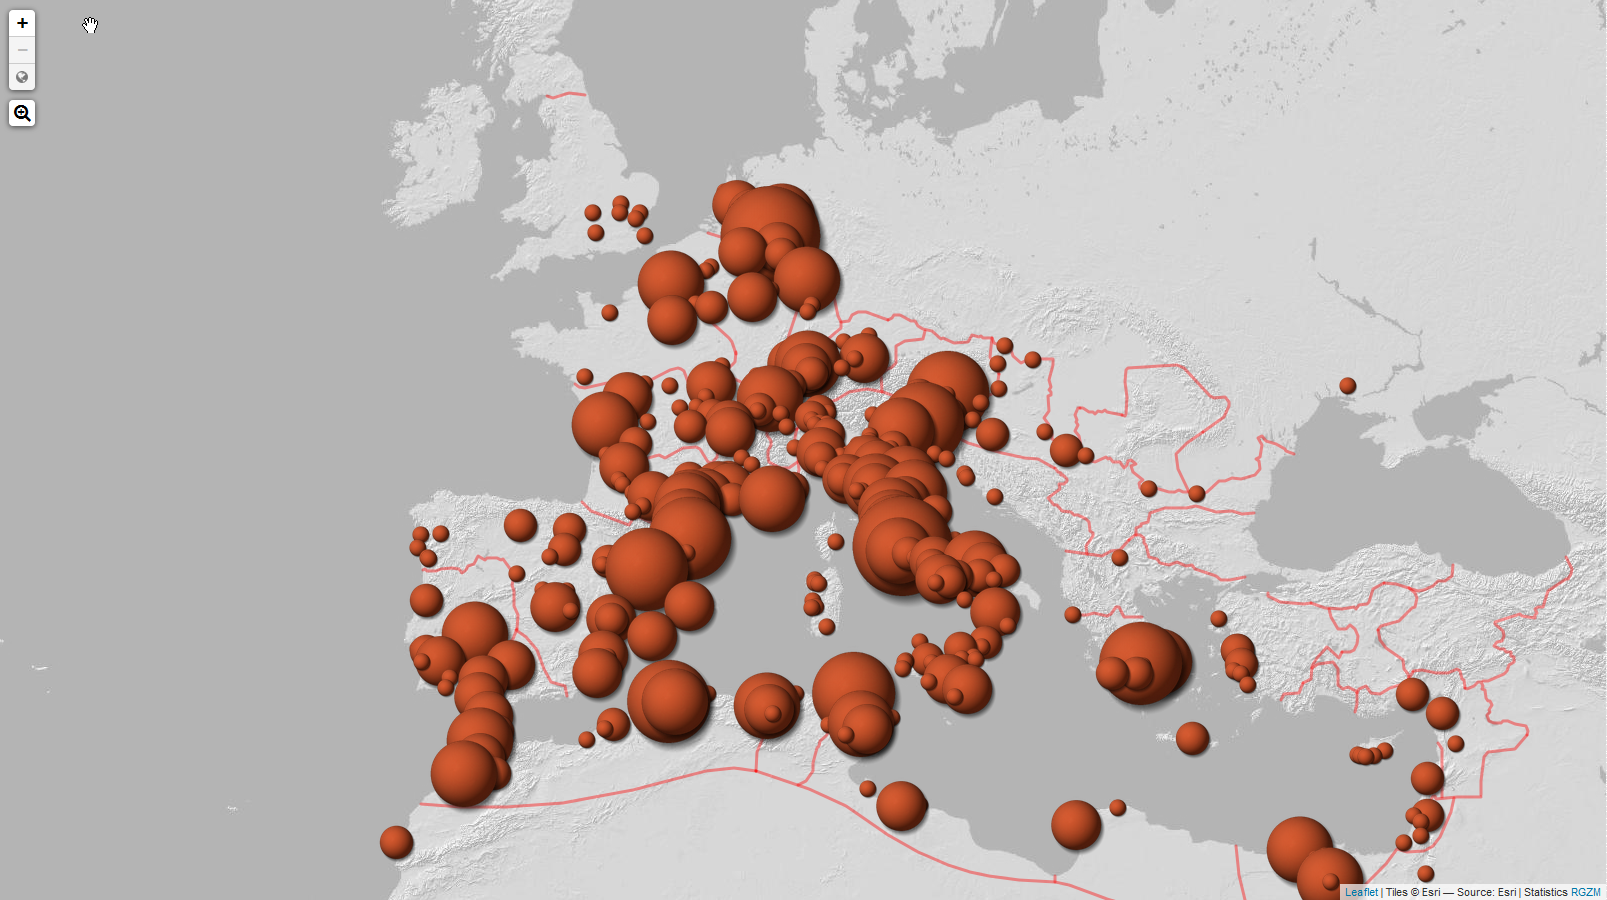
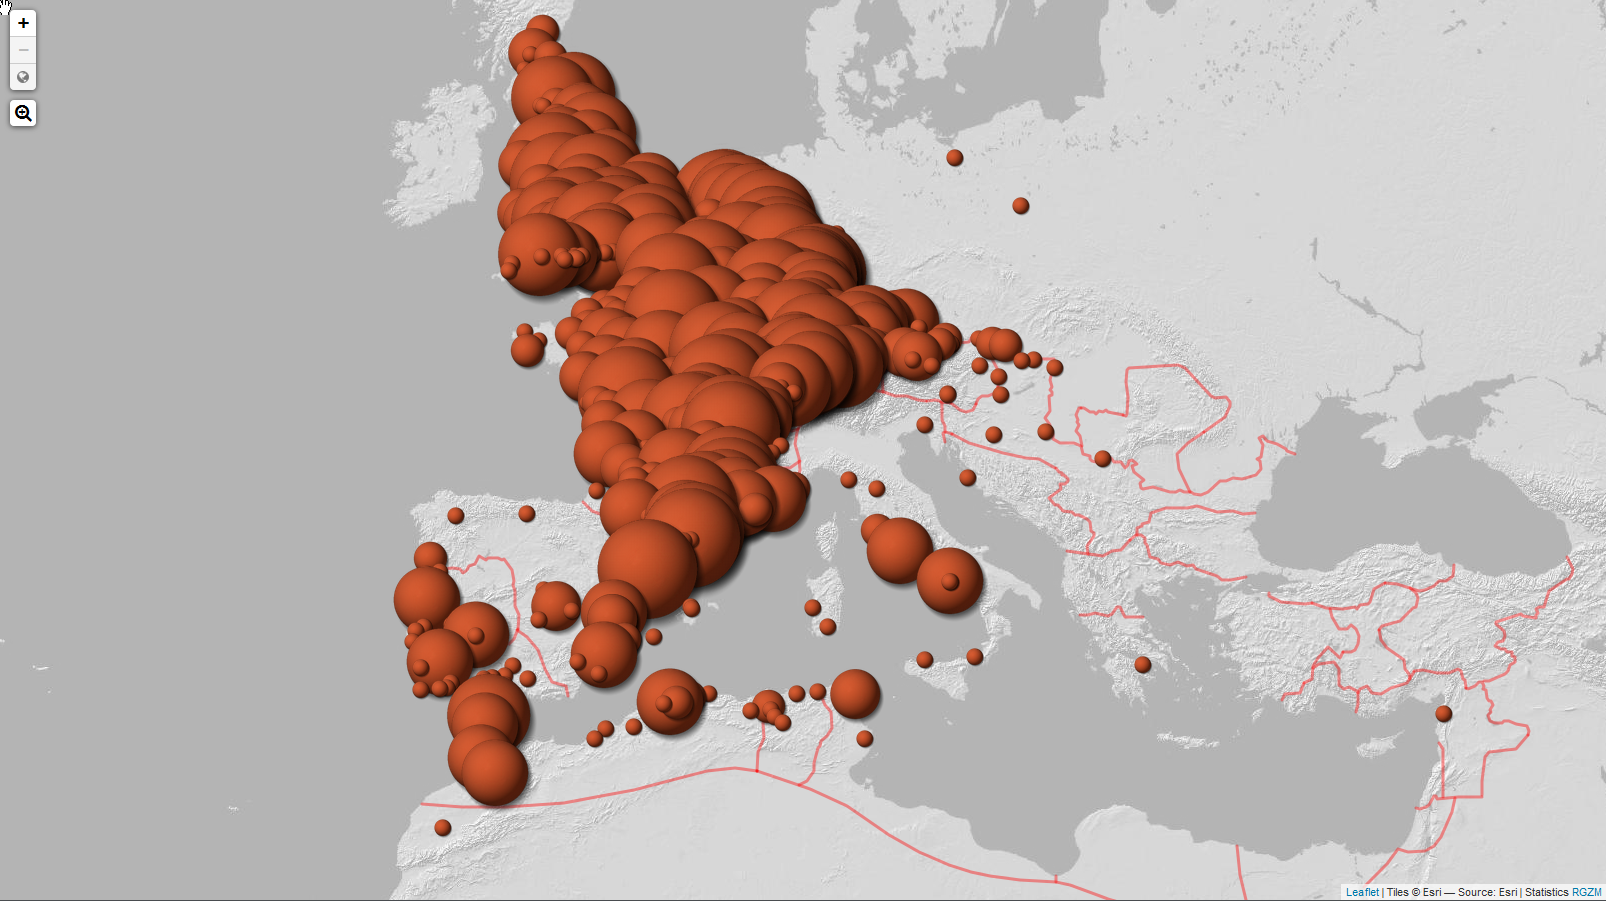
This phenomenon was driven by the founding of huge kiln sites, which took advantage of the market penetration (Figure 1). Beginning with the Italian samian kiln sites of Arezzo and Pisa after 30 BCE, by 10 BCE in Lyon and with the installation of the major kiln site at La Graufesenque in 10 CE, the production was already outsourced into Gaul (Mees 2011). This geo-chronological development continued further north with samian production sites in Les Martres-de-Veyre and Lezoux around 100 CE and ending with large production centres in Rheinzabern and Trier, which were founded c. 150 CE. With its thorough standardisation it achieved market shares that even medieval or early industrial industries could only dream of (Figure 2, Figure 3). Although the Roman production centres of samian were gradually moving from Italy via southern Gaul to the Germanic provinces, this case study restricts itself to the exported products of the kiln sites of Arezzo in Italy and La Graufesenque and Lezoux in Gaul, because the evidence from these production sites and their exports is particularly abundant. Although the, at first sight, indisputable importance of this Roman tableware for the analysis of trading patterns and its socio-economic drivers was suggested very early in archaeology (Dragendorff 1895, 18; Déchelette 1904, 105 and following; Knorr 1919, VII), the lack of large mineable electronic datasets has until very recently hindered any progress in this research field. The databases that have now become available at the Römisch-Germanisches Zentralmuseum in Mainz (RGZM - http://www.rgzm.de/samian) are a unique opportunity to start exploring, quantifying and verifying these research tracks. In terms of quantities, the available 246,000 stamped vessels from 3700 European sites in the RGZM database currently comprise the largest dataset available on Roman tableware on the internet.
The RGZM database was originally based on the publication of Names on Terra Sigillata (NoTS) in nine printed volumes by Brian Hartley and Brenda Dickinson at the University of Leeds (Hartley and Dickinson 2008-2012) and the Corpus Vasorum Arretinorum by Philip Kenrick based at Oxford (Oxé et al. 2000). The database was conceived to create statistical exploration tools for interpreting the data and to address the problems of keeping the information up to date with new material (and revisions of existing information). Research access to the database became free in 2016 and the data are also available as a web feature service at the internet address mentioned above.
It must be stated, however, that a few caveats apply when evaluating the dataset: in certain periods some samian forms were less frequently stamped or not stamped at all and therefore remain largely under the radar of this kind of research. In particular, final conclusions about table usage are not easily possible with this dataset. For example, the first-century unstamped vessel form Drag. 35/36 could have been used for presenting food, and the form Drag. 37 must have made an impressive sight on every Roman dinner table, yet its occurrence in the dataset is heavily under-represented because this form was also frequently unstamped. The adagium of Arthur Conan Doyle, that 'it is a capital mistake to theorise before one has data. Insensibly one begins to twist facts to suit theories, instead of theories to suit facts' (Polak 2000, preface), is therefore also applicable to research on trading patterns and table usage. Before diving into the masses of a quarter of a million samian stamps, the fundamental question arises whether this material is suitable to provide such answers at all.
Although in terms of transport volumes, Roman samian was certainly a 'piggyback' ware, consisting of only up to 10 per cent of the cargo weight of an amphora transport (Lewitt 2013, 116), in terms of market value it is likely to have played a much more important role. During the 1980s several historians suggested that military buying power exerted influence through the distribution networks with a resultant effect on the surrounding geographical areas (Middleton 1980; Wells 1992; Whittaker 1989). The discussion at that time, however, was not driven by verifiable large quantified datasets, but only by very general observations of the European distribution of samian. Following this tradition, in more recent times, it was even suggested that samian trade might have been directly related to the military administration or even 'directed trade' (Weber 2013, 208-9). But the mass of epigraphical evidence from either inscriptions on stone or Egyptian papyri or the wooden writing tablets from Vindolanda and Vindonissa are virtually silent about any active role of the military administration when it comes to private commodities of soldiers, such as cooking pots or tableware (Schmidts 2011, 112 and following). Moreover, a supposed 'subsidised distribution' (Fulford 2013, 16) along the governmental cursus publicus (later on also called cursus vehicularis), would somehow have had to be related to other deliveries like grain from the Gaulish provinces towards Rome, as it was organised within the annona (Schmidts 2011, 115). For the trading mechanisms in amphorae, Rodríguez postulated links between amphora production and the annona as a part of the army supply, which would have been directly related to the military governance in Germania (Rodríguez 1986). This would all have been organised in thepraefecture annonae, which also would have taken care of the inter-provincial clearance of the finances involved. However, with more and more data becoming available concerning the amphora industry, this idea has been firmly rejected recently (Ehmig 2003, maps 2-16). The debate about the existence of a 'military market' seems mainly to be fuelled by ex nihilo arguments. Curiously, this suggestion of a connection with a military/governmental involvement ('staatscontracten') still keeps returning when it comes to samian studies (Bijl 2013, 155). A variety of opinions exist, ranging from confirmation of the theory relating to a 'military market' drawn from samples (Webster 2013; Willis 2013), to rejection because not only do site datasets exist allowing for exactly the opposite conclusion, but there are also whole military regions, such as Spain, showing patterns that do not fit this stated theory (Mees 2011, 4; 2002).
An important fact is frequently overlooked in the discussion: the main trading direction of Gaulish samian was in the opposite direction of the annona. The flow of samian pottery headed from the kiln sites in Gaul towards the large consumer area along the Rhine, Danube and Britannia. Any military involvement would have been primarily related to the legions and auxiliary troops that were stationed in the north-west provinces, usually having adjacent civil canabae that regularly developed into larger civil towns.
In terms of terminology, there is a floating transition between what can be called a 'military site' or a 'civil site' (Willis 2011). It is frequently very difficult to distinguish whether material comes from a purely military site, a mixed site (military camp + vicus) or a purely civil site. In this research project, a site is considered as predominantly 'military' when there is a military reason for its location. The military camps at Hadrian's Wall, for example, are there because of the military function of the defensive wall. On the other hand, although sites like London and Augst had temporary small military camps, they were – as Tacitus already stated (Church and Brodribb 1942, XIV, section 33; Deschler-Erb et al. 1991) – clearly there to protect the traders and civilians already living in these places. Thus, the majority of the population must have been civilian, or otherwise formulated: people were living there for reasons of civil economy, not for military reasons. In this study sites that developed out of large pre-Roman settlements are basically considered as civilian, although now and then usually smaller military contingents were temporarily stationed in such places. As for the vici and canabae adjacent to military camps, their economy was usually driven by the income generated by the soldiers in the military camp. Apart from that, in the present dataset it is often not known where exactly the samian material came from. Large amounts of samian were found in the nineteenth century without precise provenances within the individual sites.
The economic development of basically civil towns like Augst, Kempten, Lyon, Narbonne or London was certainly not a primary task for the army. It is true that several of the frontier zone provinces were under military administration and that especially the founding (and disappearance) of the kiln site of Lyon correlates chronologically with large military operations in Germania Magna. In general, however, the sources suggest a very clear and distinctive picture: that Roman soldiers had to privately arrange the smallest details of the requirements of their daily life. If goods were required from a longer distance, the soldiers had to obtain them, as the example of a Roman soldier from Vindolanda in Britain demonstrates, when on a shopping tour for textiles in Gaul (Bowman and Thomas 1983, no. II 255). Since first-century wine merchants were living inside the Roman legionary camp of Vindonissa, there is no serious argument that the military administration, let alone the government, was engaged in trading goods that were not directly relevant to military fighting capacities (Speidel 1996, 37-38). This also neatly demonstrates that it is next to impossible to talk per definitionem about a 'military context' of all the material that comes from a military camp, especially if the precise function of the individual find context within such a camp is unknown. However, it is our experience that when studying the main structures in samian distribution, find contexts of individual finds can be relevant, but generally do not disturb the general patterns and hence should be considered more as a kind of 'background noise' within the enormous amount of material that has now became available for analysis.
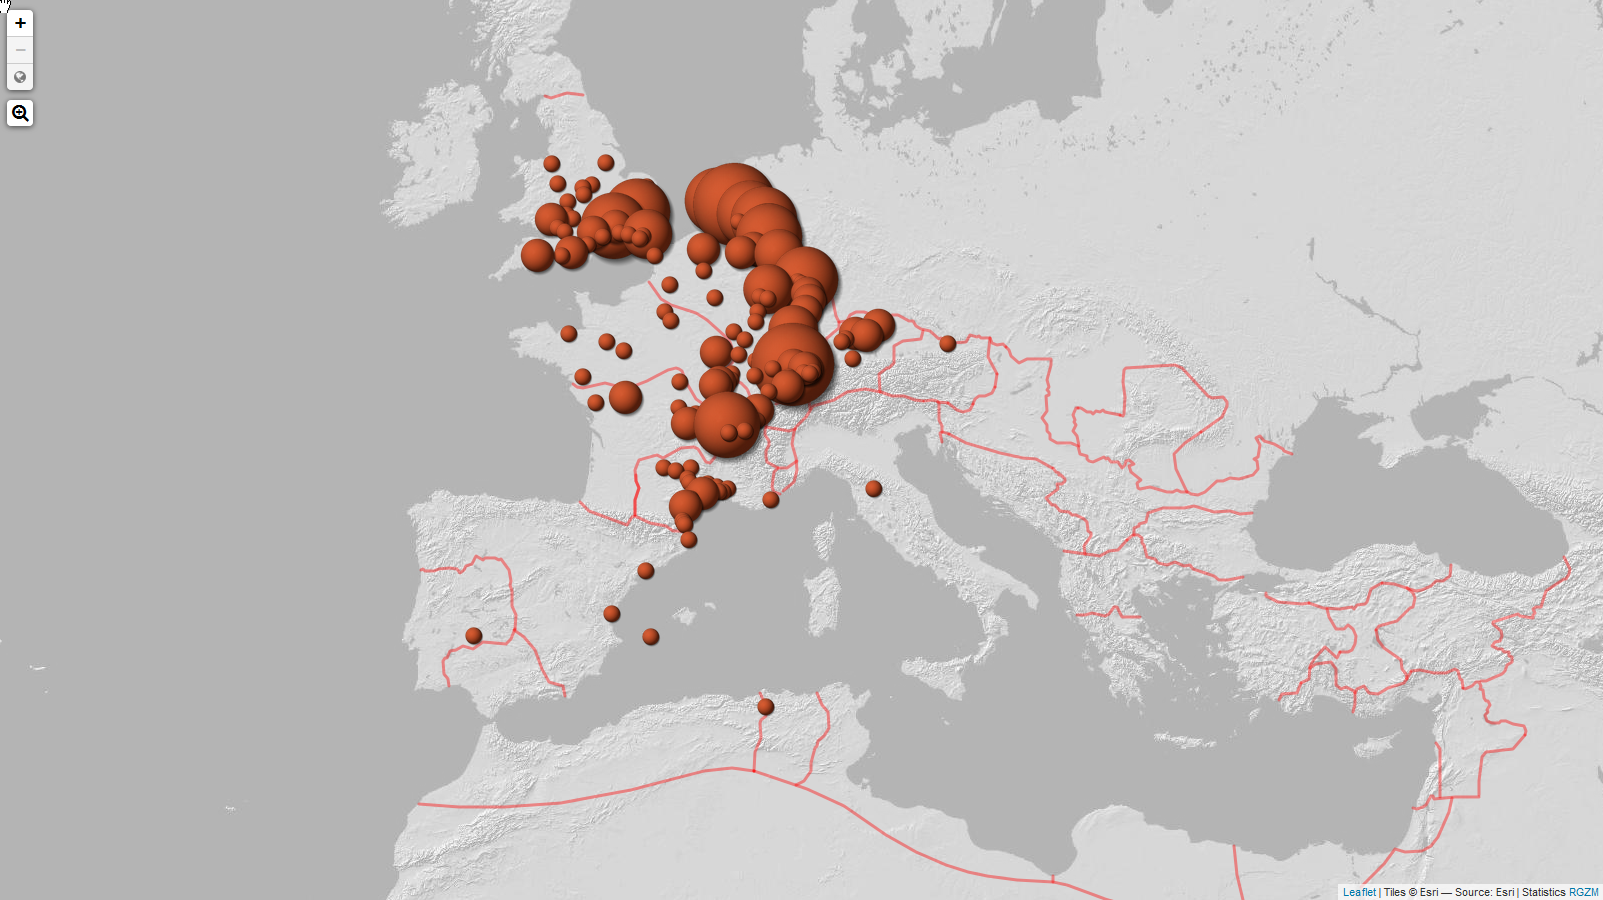
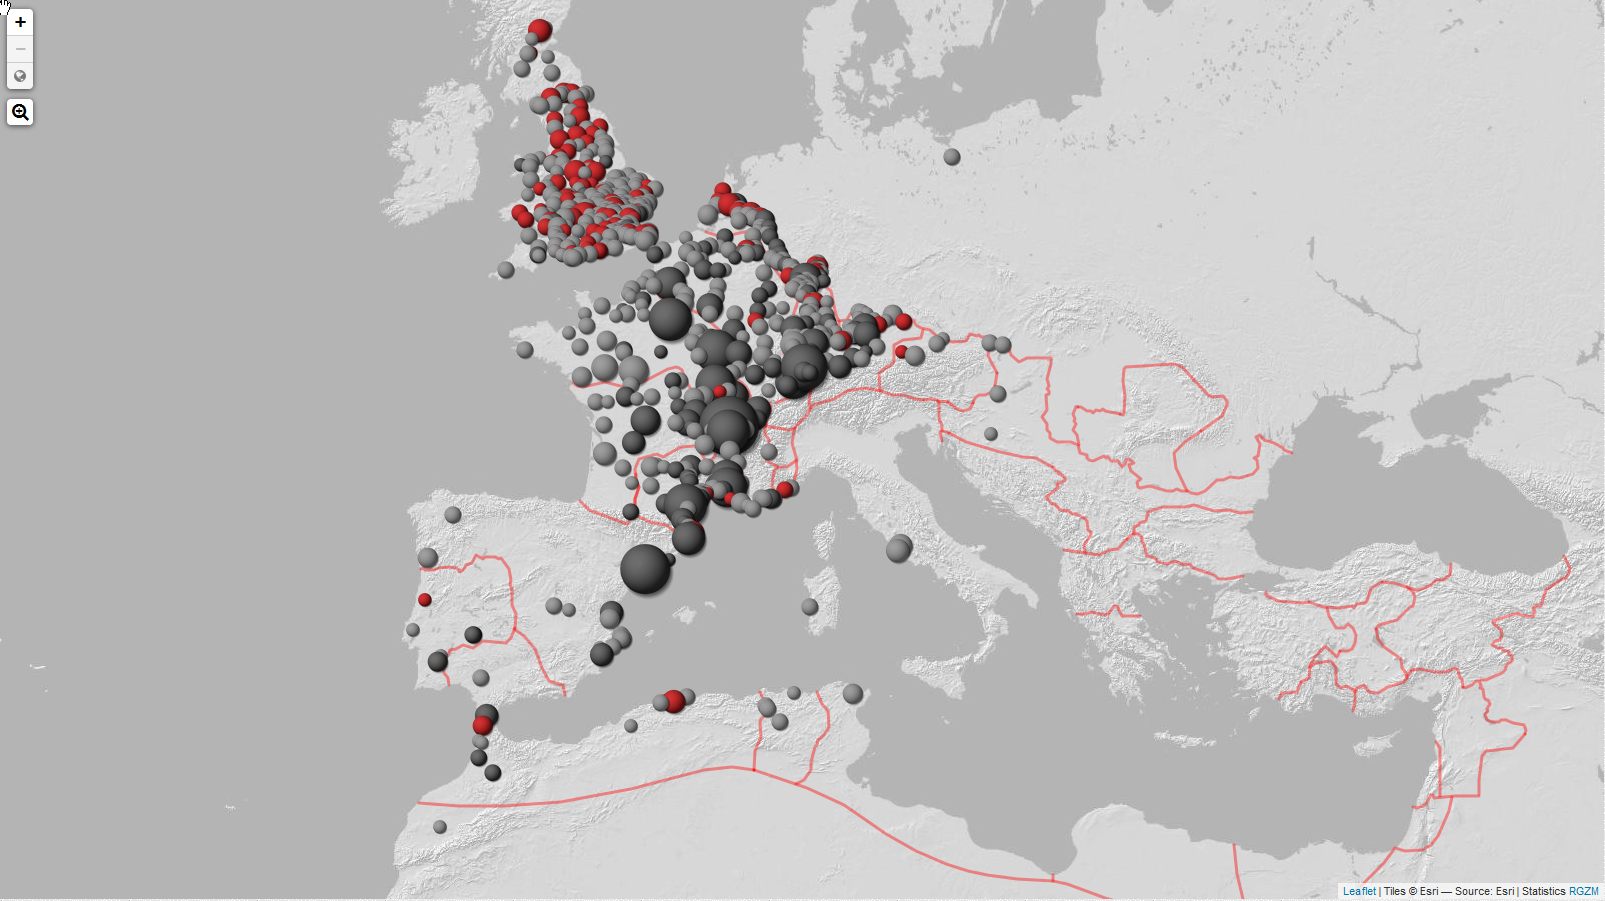
The distribution maps both of production centres and many single potters seem to show clear patterns that do not fit to any military administrative district (Mees 2011). The products of potters like Aquitanus from La Graufesenque, for example, are found in significant quantities both in Germania Inferior and in Britannia, which belonged to different military administrative regions. Apart from that, in the completely civil province of Gallia Belgica, significant amounts of this potter's work have been found (Figure 4, cf. Figure 13). Therefore, there was apparently no such thing as a 'military market' (Lewitt 2013, 15) in a strict sense when it came to long-distance trade. The examples of 'military pottery' made in the vicinity of military camps for local needs are well known, but these are not the focus of this article.
It is unlikely that such distributions result from a coordinated approach of two or even three adjacent military administrations, since they can easily be explained by a much more general phenomenon such as the general increase in buying power in provinces where the military was stationed. In the case of Aquitanus, datable between 40 and 65 CE, one may even think about a relation to the massing of legions in preparation for the conquest of Britain in 43 CE. Also, the huge amount of samian found on civil sites is a strong warning against talking about a 'military market' in the frontier zones without further evidence. The masses of samian that are found in predominantly civilian towns like Augst, Arentsburg-Voorburg, Kempten, London or Tongeren do not argue for any direct military intervention related to the trading of samian. Apparently, militarised (frontier) regions were an attractive market attracting goods like a magnet because soldiers were (wisely) paid regularly in cash. Thus it seems unlikely there was 'directed trade' or 'subsidised trade' of samian towards any specific region, simply because the general buying power generated by the regular soldier's pay in the region (not to be confused with individual sites) is a much less complicated explanation for the observed distribution patterns.
Trading patterns derived from currently known distributions of potters can be analysed statistically to assess any civil or military influence on trading structures. While transport mechanisms from the kiln sites La Graufesenque and Lezoux to the commercial centre of Lyon remain unclear, and may have remained in the hands of huge merchant houses, the occurrence of various negotiatores cretariae inscriptions north of Lyon strongly suggests a more personalised trading pattern further north (Aubert and Raepsaet 2011). The pattern for Britain may have been different because of its geographical situation. In theory, samian may have been traded according to two models in the north-west parts of Europe. In the first model, a merchant starting from a regional town would follow the villages, towns and military Limes camps up to the point when he had sold all his goods. This trading model would produce chain-like structures on market analysis maps. Alternatively, in the second model, a merchant could have been stationed in a major regional town from where he sold his goods to customers who came to the city. This second model does not exclude the possibility that merchants would do daily trips to the villages or military camps in the region, but it is important to note that trading would have been based on a structure of regional centres. This second marketing model would result in hub-like structures on market analysis maps.
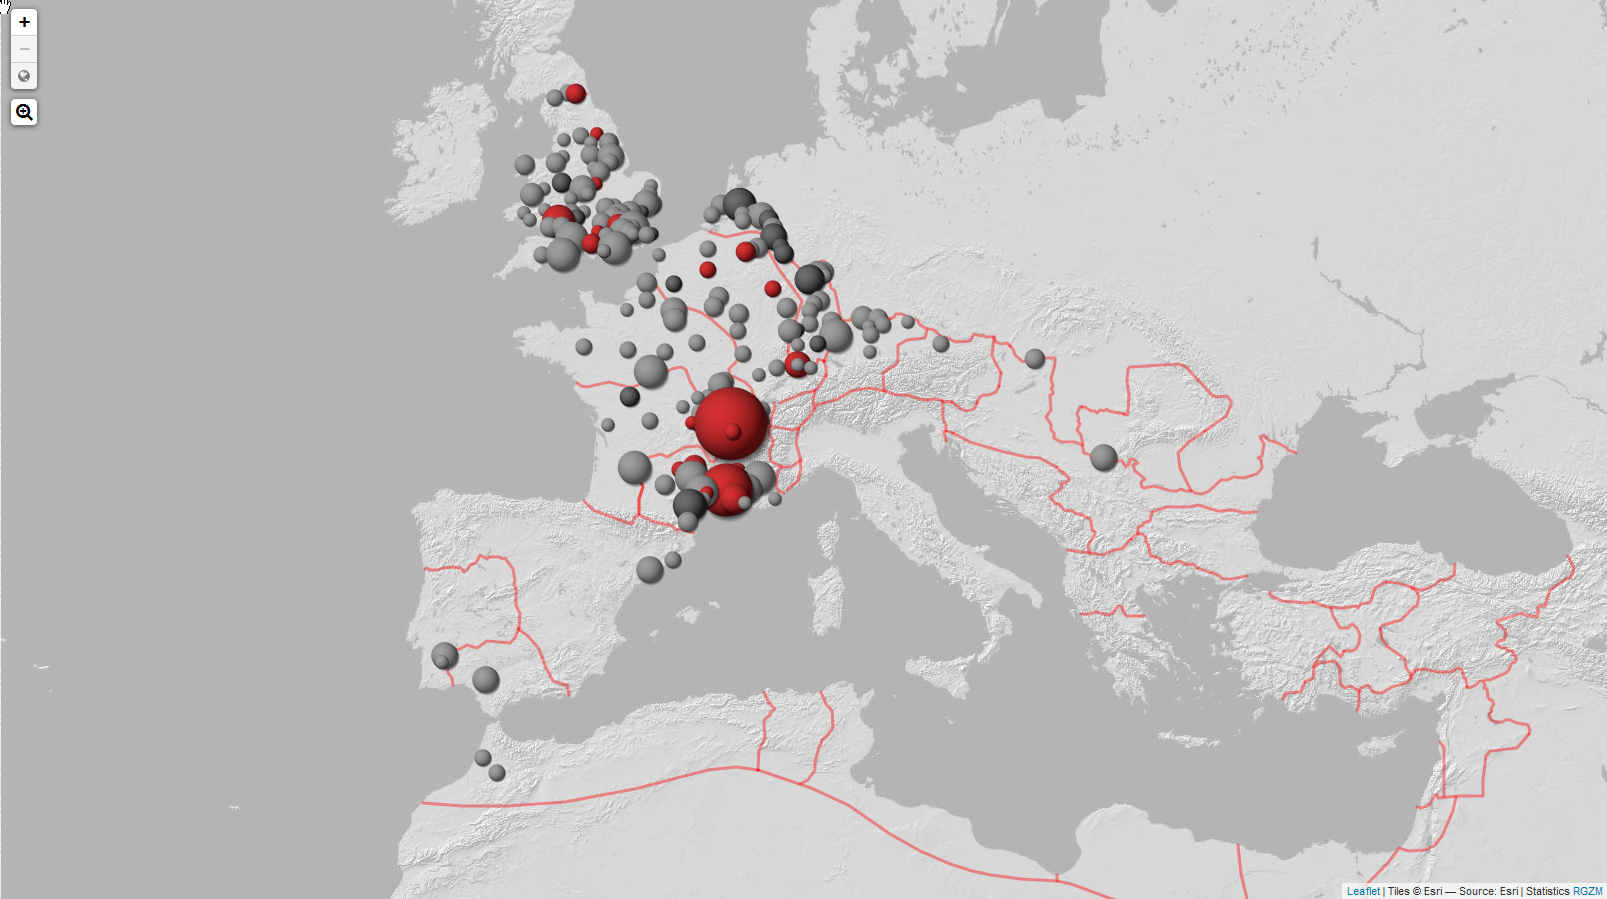
An especially designed network analysis program to analyse such structures makes clear that apparently hub-like market structures were being used to distribute samian (Mees 2016). As for the method of quantification used in this analysis, it is essential to point out that there is a distinction between the observed amount and the statistically expected amount, assuming that samian had some kind of normative distribution. The method used to calculate the proximity of samian supplies between two specific sites is, of course, always a function of quantity and distance. The following example quantifies the proximity of e.g. Abergavenny and London for the supply of products from the potter Aquitanus. At Abergavenny, 1 out of 13 pots are stamped by Aquitanus (=7.69 per cent). This is above the expected normative value of 0.20. For London, 57 pots out of 6341 are stamped by Aquitanus (=0.9 per cent), whereas the normative expected value is 98.06. The 'Network Density Value' or 'Threshold Value' of the connection Abergavenny-London is established by dividing the sum of both expected values by the distance in kilometres. If the number of pots in London is greater than the expected value, the dot on the map, produced by the network analysis programme and used in this article, will be coloured red and a blue line between the two sites will be drawn. Hence, if one sets a filter on the above-mentioned 'Network Density Value', e.g. by requesting that the value can be up to 1, virtually all dots will have joining lines. If the filter is set to e.g. 0.1, only the sites with very high affinities in terms of nearby occurrences of identical potters' dies will be displayed with red dots and will be connected by blue lines. Thus, the number of interconnected sites is dependent on the choice of the 'Network Density Value'.
The network-building influence of sites with large quantities may seem at first sight to be very influential in this model, but weighting by measuring the difference between the expected and observed values corrects for this factor. Although the filter value of this 'Network Density Value' or 'Threshold Value' may seem somewhat arbitrary, in practice experience shows that the best interpretable network distribution maps are known to be somewhere between 0.6 and 0.8, depending on the total export volume of a specific potter.
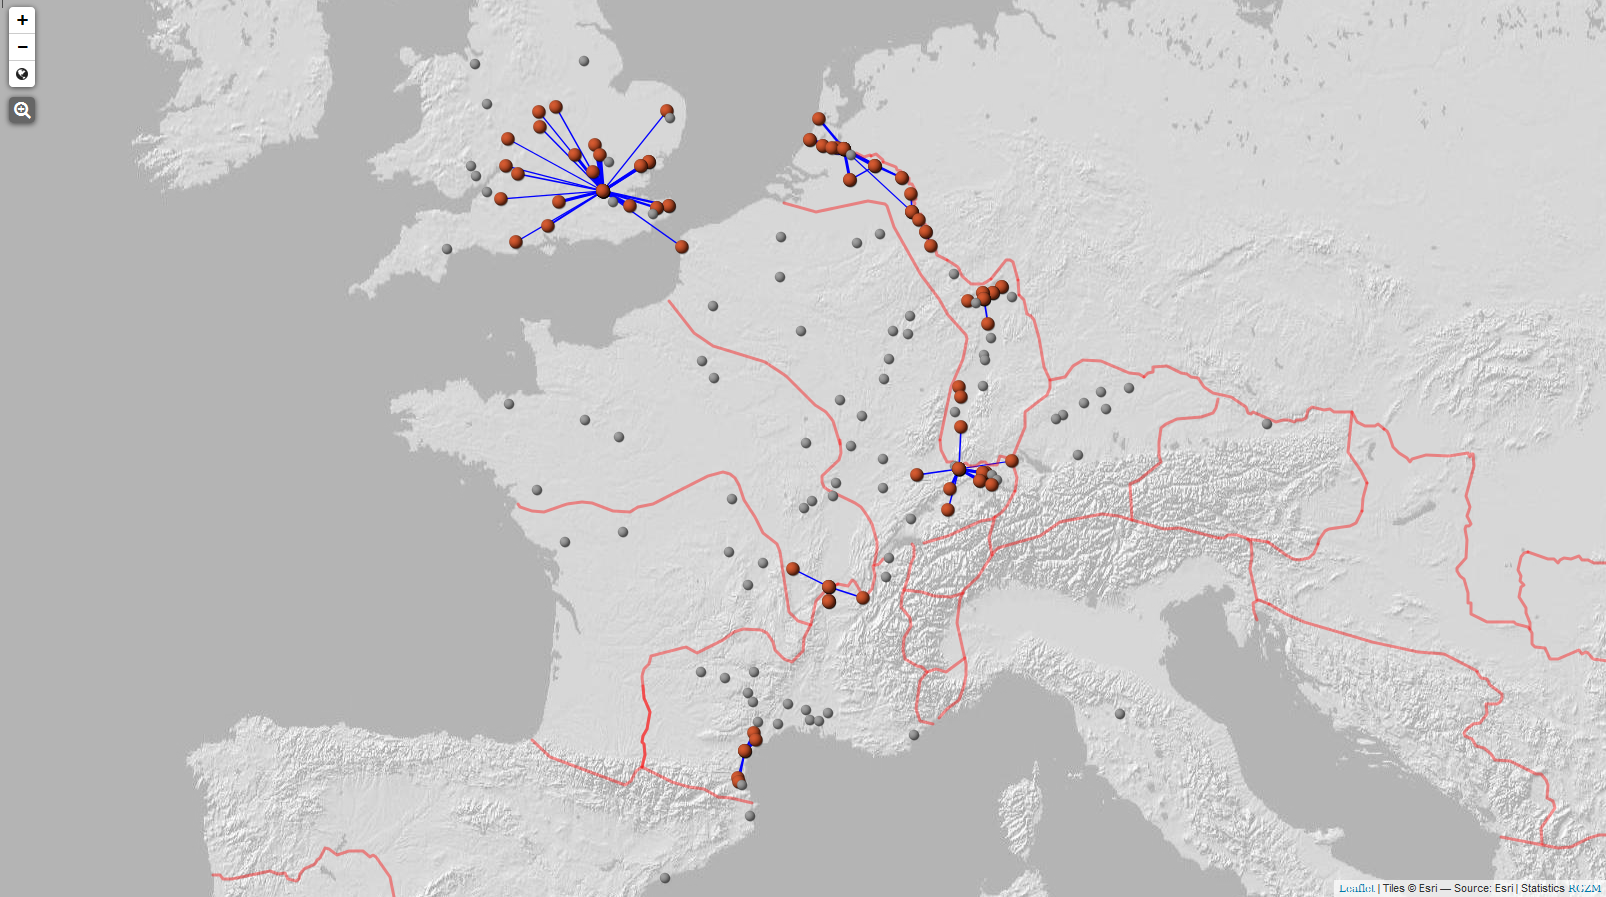
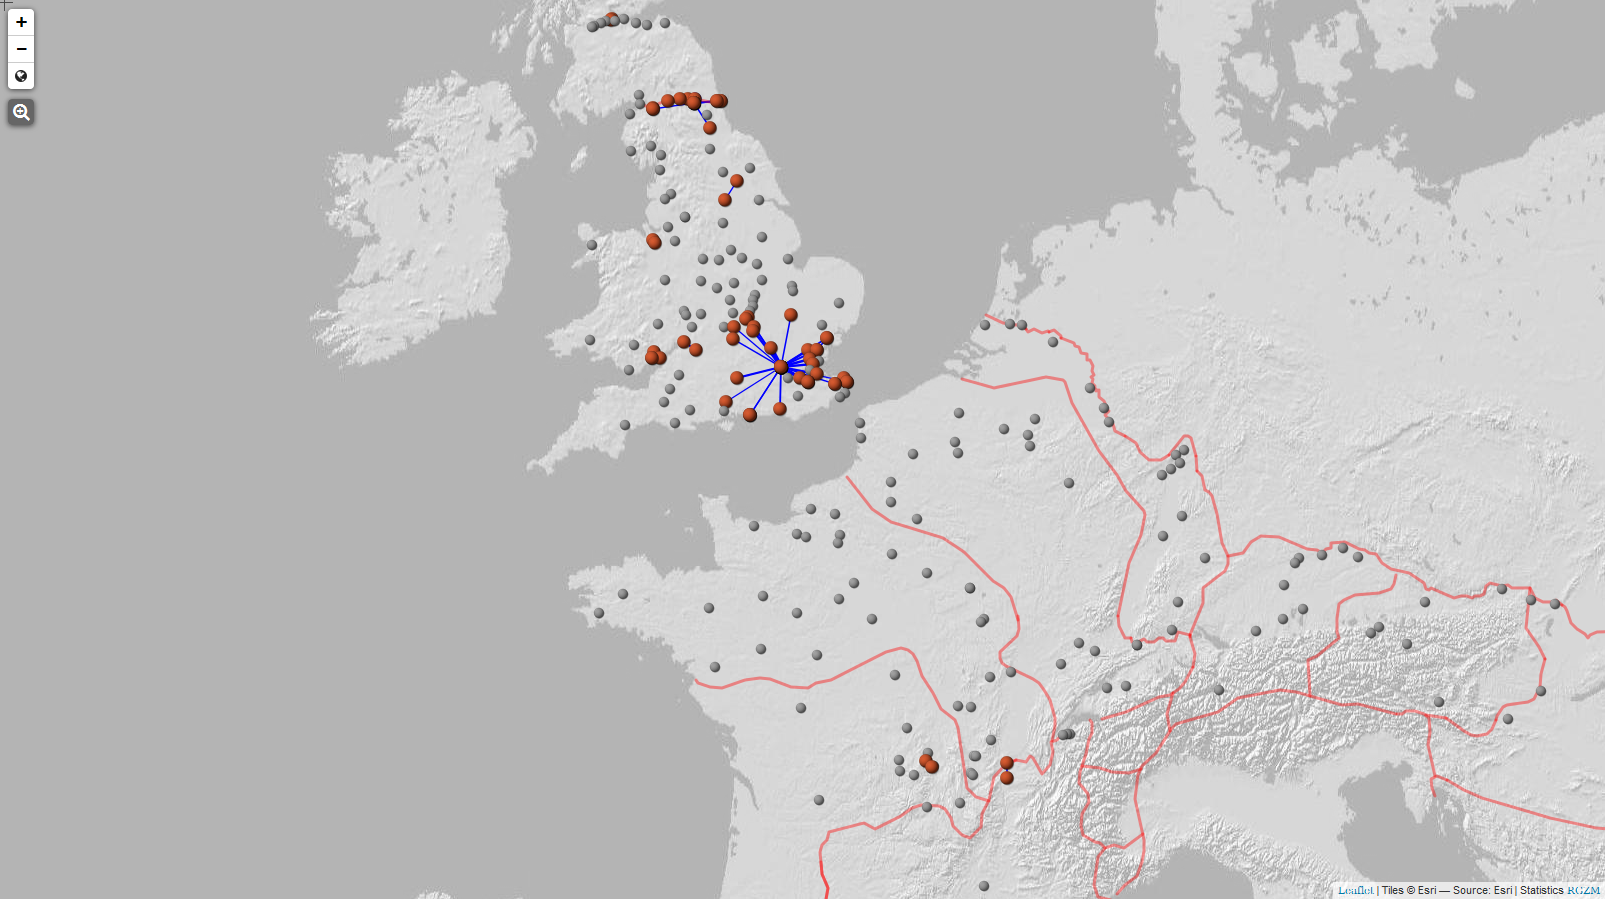
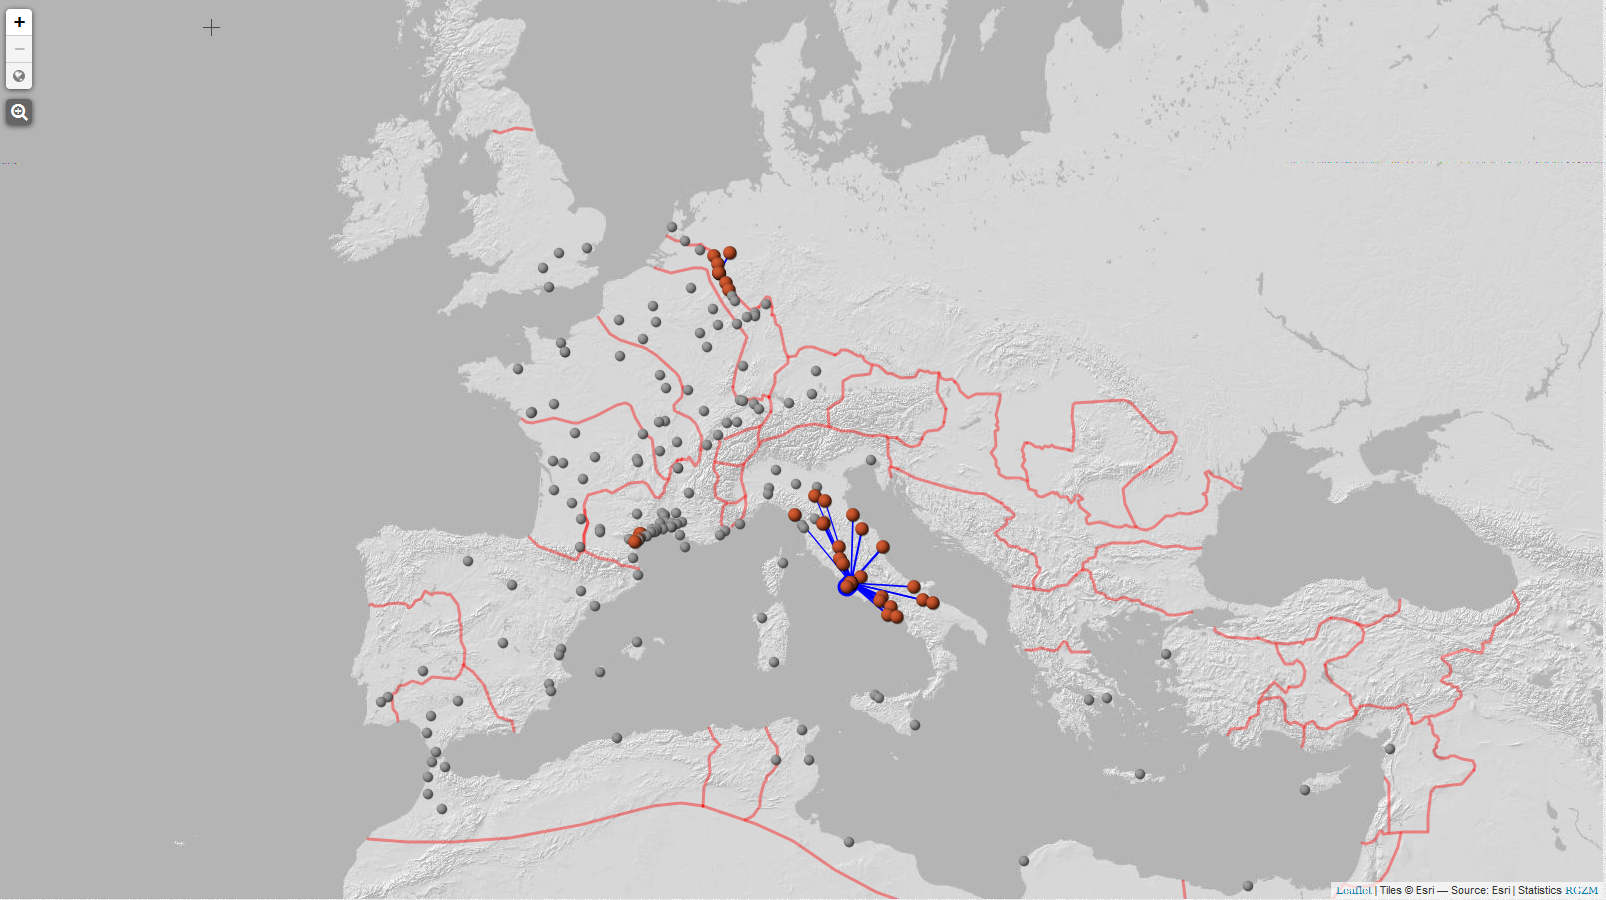
Sites with a strong statistical closeness to each other, based on the difference between the observed and expected amount of samian made by the same potter, were apparently located around sites with a strong regional importance. It is clear from a closer look at the sites with a hub function that several such important sites for the distribution of samian were entirely civilian (Figure 5, Figure 6, Figure 7). Whereas Neuss, Vechten and second-century Hadrian's Wall, with their mixture of military camps and adjacent civil canabae or vici, had strong military connotations, towns like Augst, Lyon, London, Narbonne and Rome were more or less entirely under civil administration. Therefore it would be impossible to say that there was something like a typically military-driven way of merchandising samian. On the contrary, the trading structures found at generic civil towns (which in cases like Narbonne or Rome already existed long before the military camps in north-west Europe) seem to have been fully adapted in regions with a strong military component. It is also interesting to see that in Lower Germany, trading along the Rhine has a clear influence on the flattened shape of the trading pattern owing to the natural circumstances of the Rhine as a cheap transport route. Similarly, the virtual absence of adjacent settlements along Hadrian's Wall has also influenced the shape of the regional trading pattern. However, the pattern type itself does not differ from those found at the other civilian hub towns.
The role of the predominantly civil town of London within the marketing of samian in Britannia is remarkably visible in this kind of map. A strong argument for the civil aspect of the commercial 'magnet' London is the distribution of ceramics from Les Martres-de-Veyre (Mees 2011, 260, fig. 233): this kiln site started its massive exports to Britain (and further into the Rhine estuary) precisely when Britain and Germania Inferior were deprived of part of their military components. From 104 CE onwards, legions were withdrawn from Britain and Germania to fight elsewhere in the Roman Empire (Mees 2007, 193, plate 49).
The concentration of finds from the first and second century CE in the harbour town along the Thames is rivalled nowhere else in Britannia. At the moment, the huge first-century quantities of South Gaulish samian cannot be explained by direct military influence, since, for example, the so called Cripplegate Fort in the north-west corner of London dates to the second century only (Sheperd 2012), when South Gaulish samian was already out of the market. The large amount of samian from London is certainly linked to superb accessibility from Gaul and Germania, as GIS-based least-cost routing analysis has shown (Mees 2011, 267; http://www.rgzm.de/transportroutes/). The same pattern appeared when samian imports in Britain were taken over by the Gallo-Belgic and Germanic kiln sites of Trier and Rheinzabern (Mees 2002, 153, fig. 105, 157, fig. 113). Only the ports serving Hadrian's Wall seem to have been the 'next stop' for ships coming from the Continent and sailing along the coast.
In order to identify a 'military market' statistically, it is necessary to be able to compare intra- and inter-site quantities using methods that can tell us something about the reliability of the data involved. The basic question is whether the study of samian as a research tool allows for such conclusions at all.
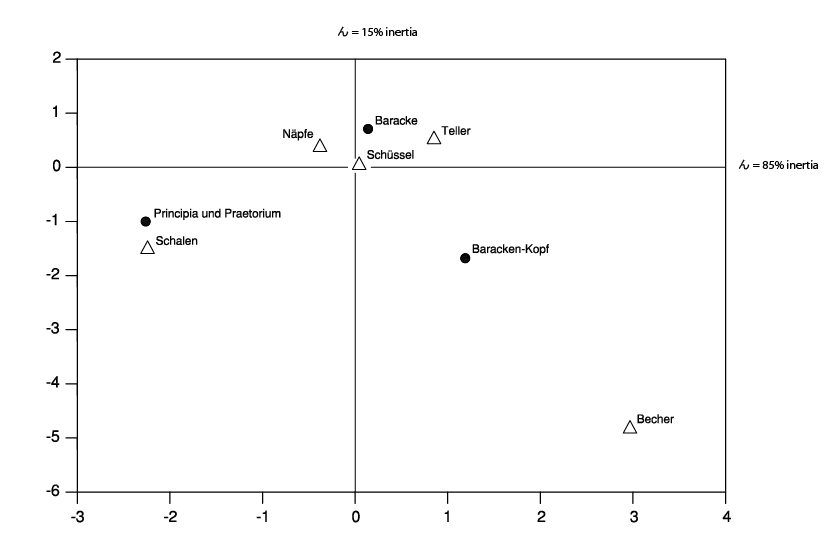
Inter-site comparisons of particular classes of vessels can only be evaluated against the overall background of distribution for the kiln sites involved. Within an intra-site approach, it is often thought that comparisons between the usage of ceramic assemblages within a Roman military camp and the surrounding civil vicus would show up different consumption patterns. Surprisingly, very little research has been done on this (Moosbauer 2002; Mees 2012; Van der Linden 2013; Webster 2013, 217ff). This may partly be due to the absence of sites where military camp and vicus have been excavated in a way that resulted in enough material to start comparisons at all and, historically, whether or not that separation was meticulously recorded. Within a military camp itself, differences between the principia, officers' residences ('Baracken-Kopf') and soldiers' barracks can be distinguished, suggesting a mixture of cultural attitudes and, possibly more relevant, the purchasing power of higher military ranks causing structurally different samian consumption patterns, even within a very small area (Figure 8). The presence of a civilian wine merchant living in a military camp, mentioned above, however, also demonstrates the limitations as to how far the Roman civil and military world can be untangled.
The picture gets much more complicated when comparing a military camp area with the surrounding more civilian-orientated canabae or vici. Available research for the first century CE at Nijmegen suggests that the typology and the proportions of different types of terra sigillata were very similar in both the canabae and military camp (Van der Linden 2013, 92). Similar conclusions have been drawn for the second and third centuries at Hofheim II (Mees 2012). On the other hand, research on the military camp and canabae of Caerleon indicates differences in supply of both areas (Webster 2013). Whereas samian has a strong capacity for demonstrating chronological differences between different areas within sites, and even within a military context itself, a more important question is the suitability of samian for distinguishing between military or civil function of individual sites, particularly taking into account the very homogeneous supply chains operating across long distances towards European regions (Mees 2011, 237; Van der Linden 2013, 92; Allison 2013).
As soon as the samian utilisation of two or more sites is being compared, there is already an implicit assumption that the quantities stem from the same consumption behaviour. In geographical terms, it is clear that the closer the individual sites are, the more likely they were obtained from the same 'mainstream' samian supply for that specific European region. At least for the first century CE, the exported masses of samian from La Graufesenque along more than a thousand kilometres establish a stable grid, allowing for comparisons even across European regions hundreds of kilometres apart. To this purpose, the observed values are also weighted against the statistically expected amounts. However, as the above-mentioned intra-site comparisons demonstrate, such an assumption obscures the potential underlying differences within the datasets. Also, regarding chronological issues, one must be careful in assuming that the output of La Graufesenque remained continuously stable during the first century. There is also the caveat that the amount offered on the market was not the same as the amount bought by the consumers. But since these market conditions were virtually identical for all sites in the north-west part of the Roman Empire, there is no reason to avoid exploring the enormous volatility of samian purchase in individual civil sites within such large European regions, in order to study consumption differences within this homogeneous group of sites (Figure 9). Most of the caveats can be speculated about, but not solved. It is clear that one can find many (even contradicting) arguments for why specific forms or potters occur in higher or lower frequencies in individual civil or military sites, which results in the problem of 'picking the best-fitting solution'. However, this is not the aim of this study. The objective of this work is to outline the general underlying patterns of the samian supply and its limitations when it comes to interpretations at an individual site level.
If even inter-site comparisons of civil sites result in extremely volatile samian consumption patterns, it is no surprise that samian cannot be used for measuring distinctions between rural and civil sites, not to mention the problematic potential for dating groups of sites based upon proportions of small amounts of samian vessels (Willis 2011, 170). It is therefore also no surprise that, for some rural sites, any explanation of occasional high proportions of samian must remain unclear (Willis 2011, 187). It is therefore for plain statistical reasons impossible to state whether or not, e.g., specific samian forms such as decorated ware occurs less frequently on civil sites.
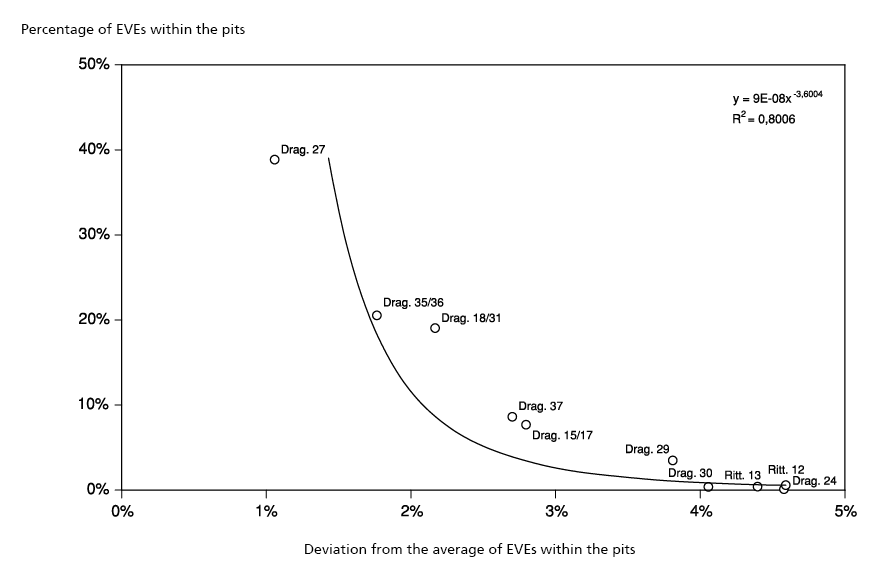
There is obviously a strong correlation between the quantities involved and the stability of percentages of certain form types. This can be made clear by volatility diagrams as well. As an example, the average deviation of certain pot forms depends heavily on the number of occurrences. Figure 10 shows that the most frequently occurring samian forms Drag. 27, Drag. 35/36 and Drag. 18/31 have by far the least average deviation within pits from an excavation.
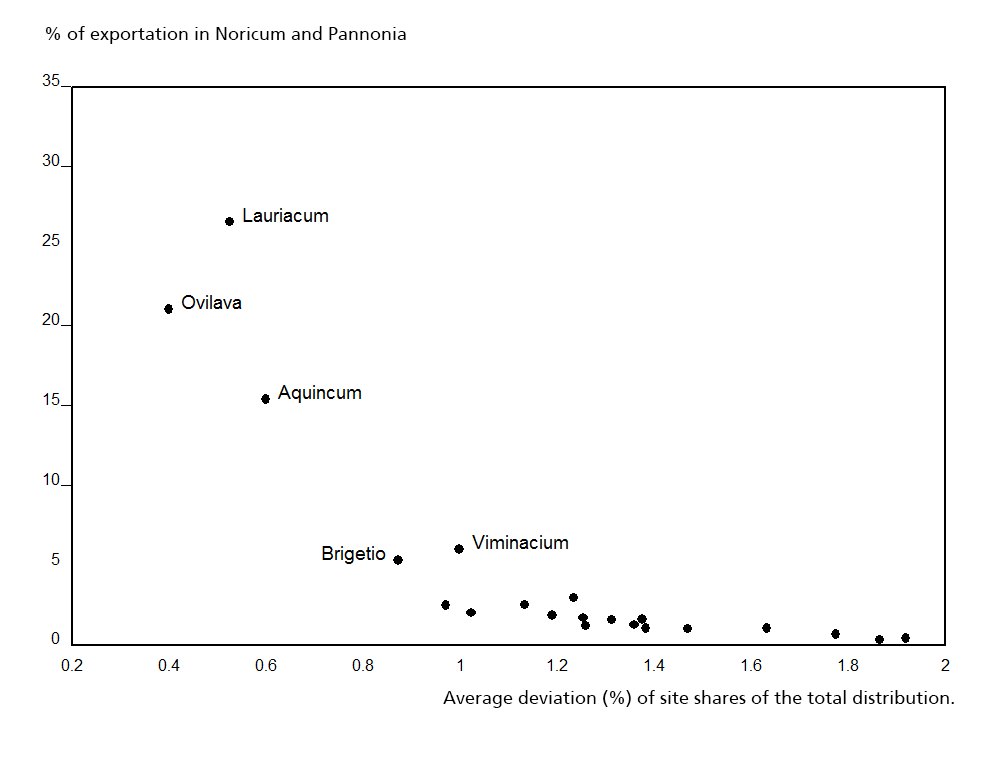
What we learn from this is that we cannot judge the relevance of our material by relatively rare form types like the decorated Drag. 29 and Drag. 37 (or decorated samian in general), but that we can better rely on 'big data', even if there is the caveat that one of the most frequently occurring forms in the Flavian period, the Drag. 35/36, was unstamped, as outlined in the introduction. This raises the question of how many pots are actually needed to assume a relatively stable sample stemming from the mainstream export of a samian kiln site. Statistics for the distribution of Drag. 37 produced in Rheinzabern from the second and third century CE suggest that a minimum number of 15 to 20 pieces is required for this form category in order to arrive at an acceptable average deviation relevant to the general distribution in the area. As a corollary, it goes without saying that the larger the number of pots per site, the more this site influences the statistics of that specific region (Figure 11).
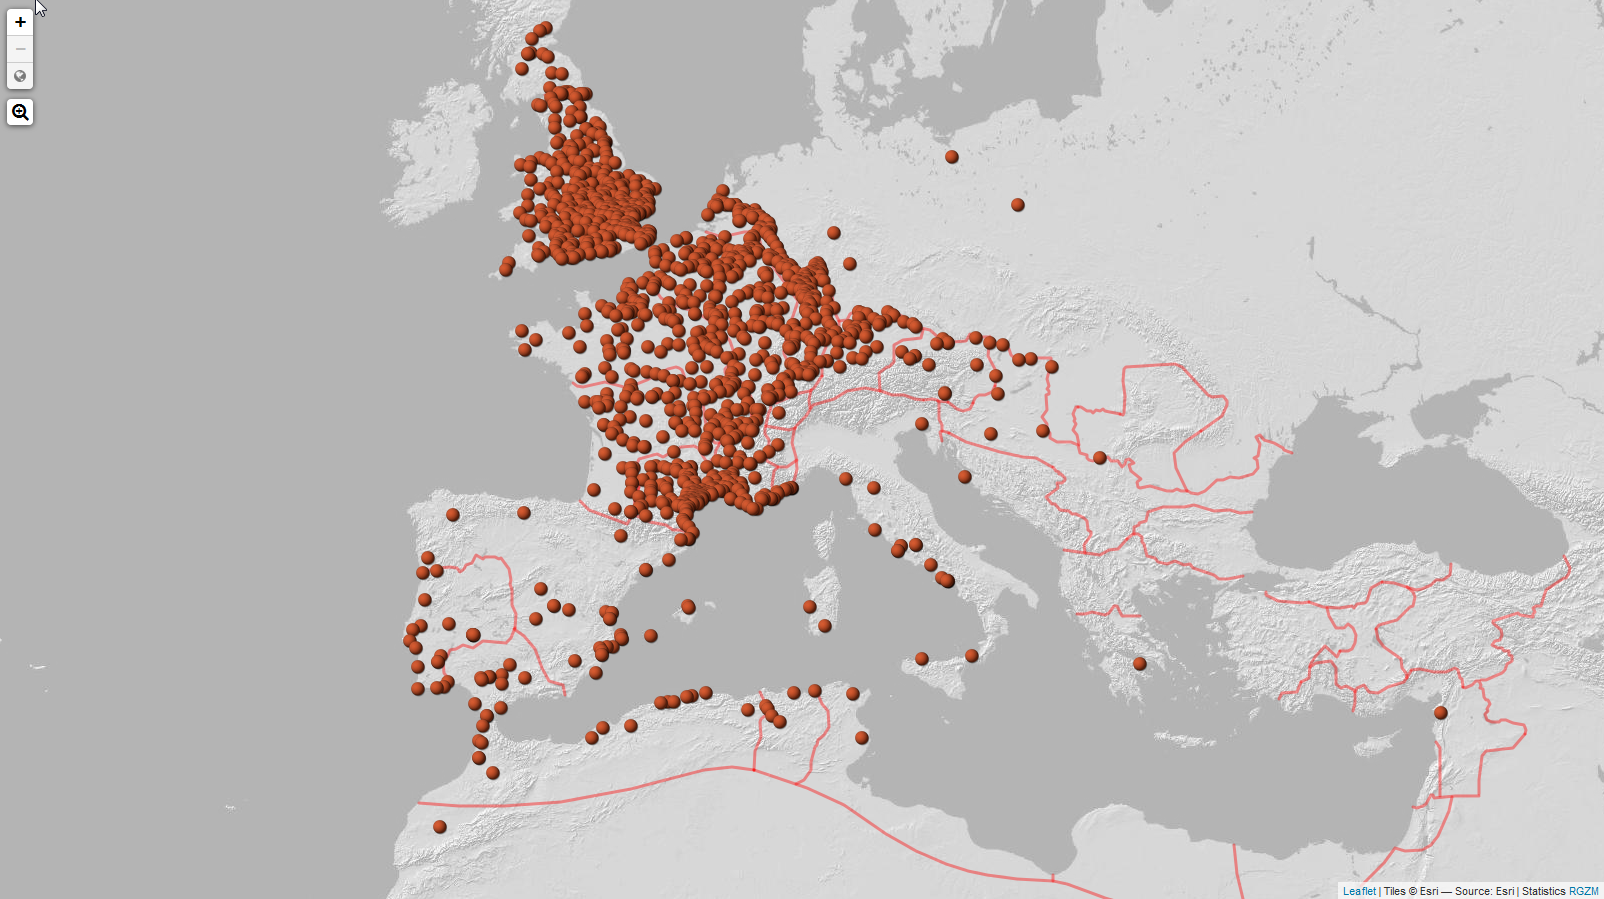
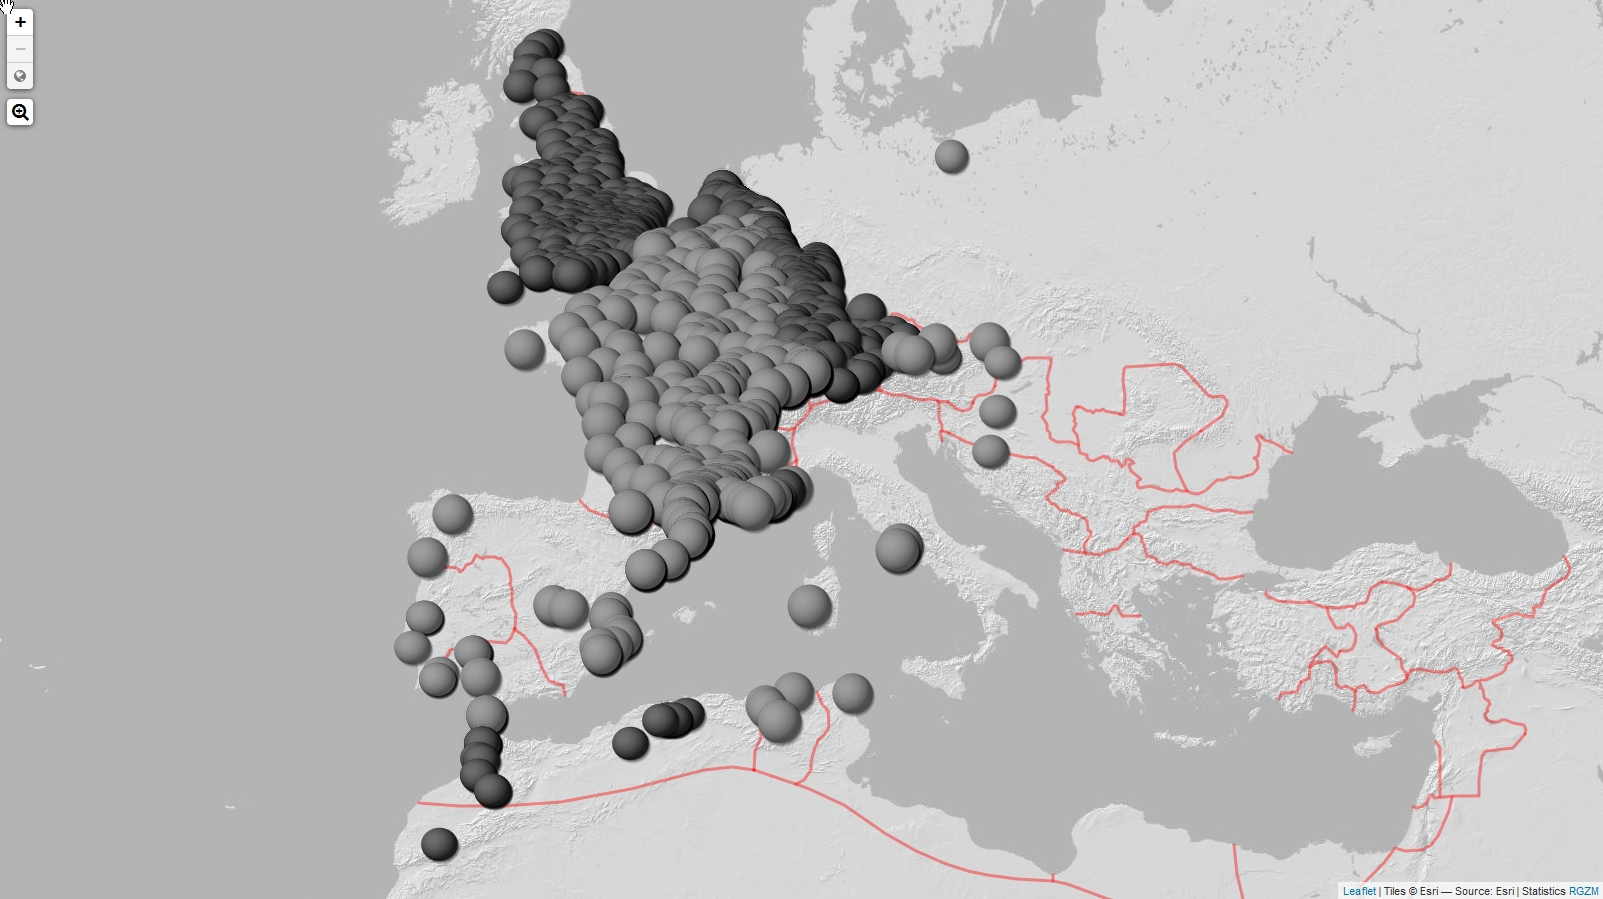
Taking into account the caveats of dealing with large archaeological datasets, a plot of the general distribution of the South Gaulish kiln site La Graufesenque, limited to occurrences only, shows the geographical dimension of its output (Figure 12). While this map does not inform us about the numbers per site, it does give an impression of the sampling problems involved. For example, the barbaricum, east of the Rhine and north of the Danube, was only recorded in a limited way by Brian Hartley and Brenda Dickinson (Hartley and Dickinson 2008-2012) during the years of the Cold War. Other work shows that the barren centre of Spain may well reflect the actual situation, even although the coverage of Spain itself was very limited as well (Nieto et al. 2005). Nevertheless, these maps reflect the reality that areas like Spain, northern Africa and especially the middle and lower Danube were supplied with considerably fewer quantities from the La Graufesenque kiln site than Britain and the Rhineland. Since the samian of La Graufesenque only reached the Danube area regularly from 100 CE onwards, here again external (chronological) influences heavily influenced the general distribution pattern (Figure 3) (Mees 1993).
As discussed above, the output of the first-century potter Aquitanus from La Graufesenque does not seem to be evenly distributed (Figure 4). Whereas the products of Aquitanus did not reach the northern part of Britain owing to the fact that he was basically working before 70 CE, a strong centre of gravity can be seen at the lower Rhine estuary. Also, the complete absence of the products of Aquitanus in the Black Forest area, only occupied by the Romans after 74 CE, gives a nice terminus ante quem for the advance of the Roman troops in Britain, as this map may suggest, with the distribution almost entirely to the south of the Fosse Way.
This raises the question whether such skewness in any distribution can be quantified. The Mócsy coefficient is a very efficient tool for this investigation, aggregating the total amounts for each province, resulting in areas (= provinces) that were supplied above or below a statistical norm (Mócsy 1985; Mees 2011, 10). This Mócsy coefficient calculates a norm frequency for a specific potter or form and its relative frequency for each province (cf. for the Mócsy coefficient see Mees 2011, 9) and so allows us to see at one view which provinces had statistically significant amounts of samian manufactured by Aquitanus (Figure 13). The amount of deviations from the norm frequencies can be visualised using the size of dots on maps. However, the chronology of the occupation of Britain and his remarkable absence within the 74 CE conquered Black Forest area does not imply that one should stop thinking after having pressed a button: such skewness is caused by the chronology of this potter, whose products hardly appear any more in Flavian contexts. If there are discrete distribution patterns towards the north, it is not surprising that there are similar phenomena towards the south: so-called 'South potters' occur frequently - but not exclusively - in the Claudio-Flavian period (Figure 14).
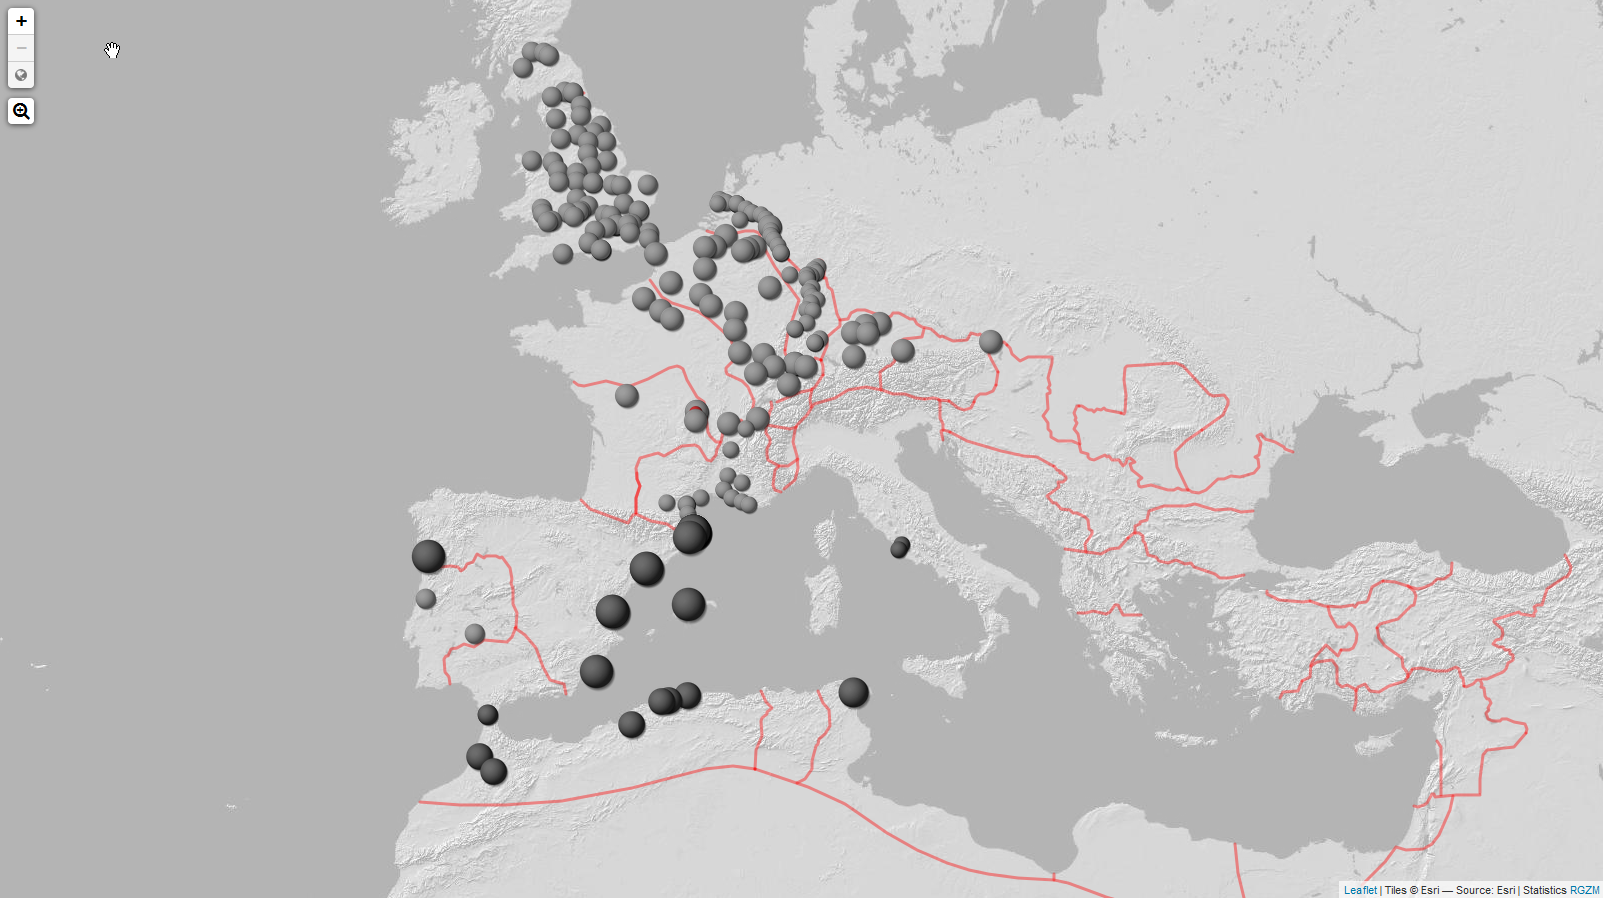
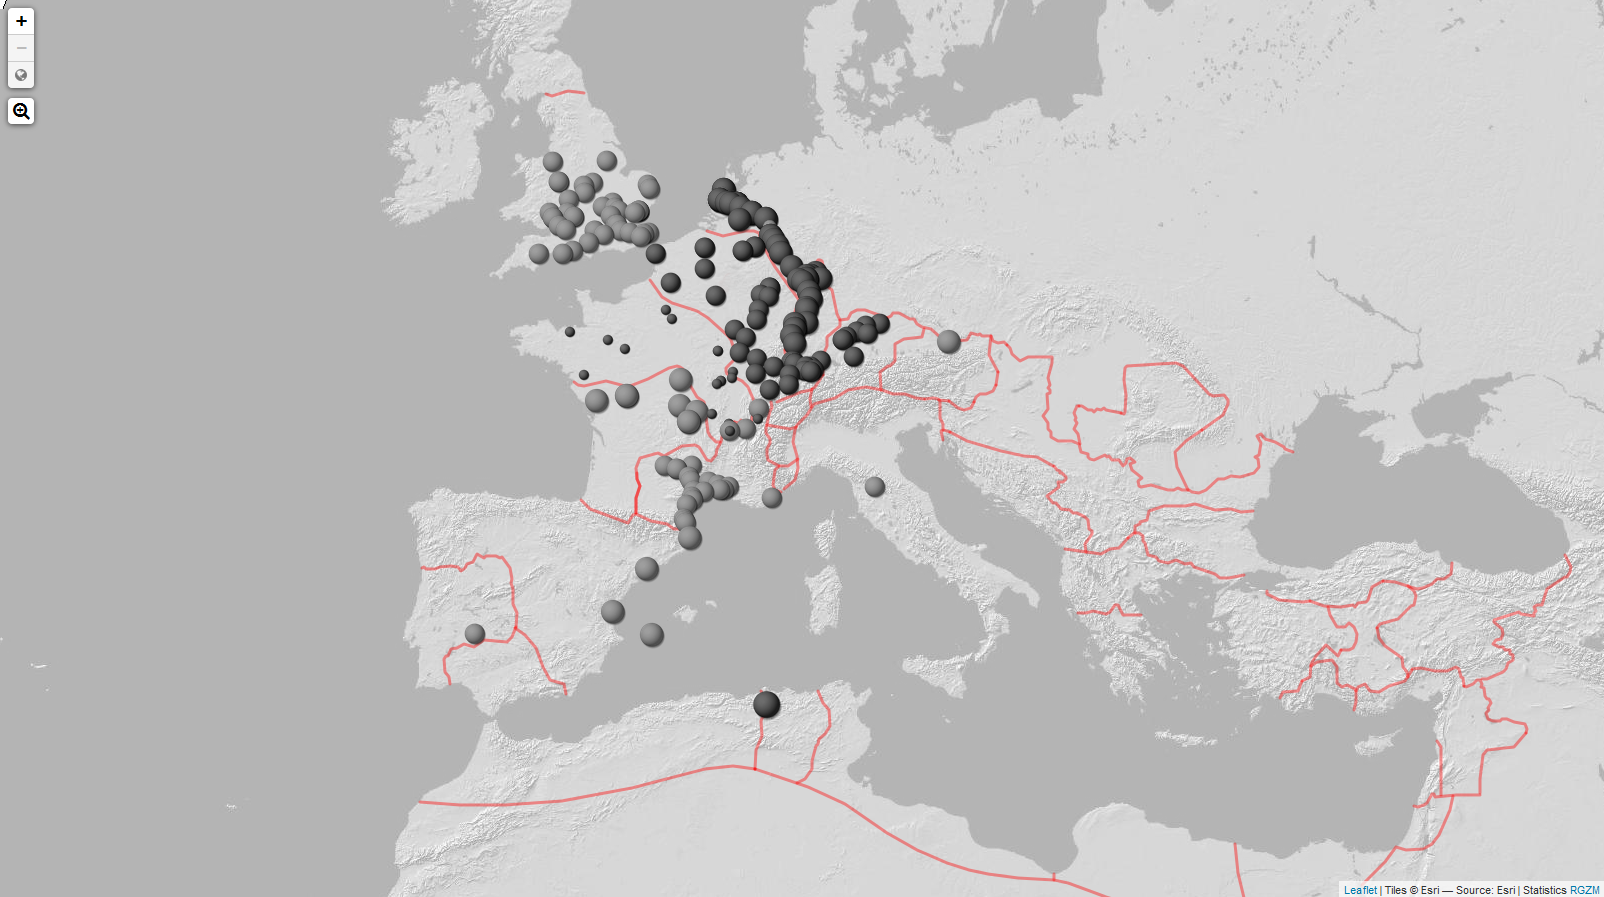
This statistical method is of course not only possible when looking at potter distributions, it can also be applied to pot form distributions. The South Gaulish Form Drag. 33, for example, was significantly well represented in Britain (Figure 15). South Gaulish Form Drag. 15/17 however, was preferentially exported towards the south (Figure 16): it occurs significantly frequently in the Mediterranean among relatively low export quantities. The same technique can be applied to aggregate forms (e.g. to dishes). A very diagnostic pattern of significant occurrences of dishes in the Roman provinces Britannia and Germania during the first century suggests a stronger preference for this kind of tableware (Figure 17) in these areas. Whether this preference for dishes can be related to military sites or military consumption behaviour is discussed below.
If the aggregation at the level of the province yields interpretable distribution maps, this raises the question of whether it would be technically possible to estimate the significance of the occurrence of a potter or a pot form at an individual site. For this purpose, the Chi-Square method gives us a measure of whether the observed values of an individual potter or pot form are above or below statistically expected values (Mees 2007, 156 passim). Since, as shown above, the observed number of pots or potters must be of a considerable quantity to be able to say anything relevant about the significance of the occurrences, we can use an aggregate function to merge groups of forms to dishes, cups or bowls.
The RGZM database currently aggregates – as far as the Gaulish, Belgic, Germanian and Raetian kiln sites are concerned - the following forms:
1) under dishes: Drag. 15; 15/17; 15/17R; 15/31; 16; 17; 17b; 17R; 18; 18/31; 18/31R; 18R; 19; 31; 31R; 32; Curle 15; 23; Hermet 28; Loes. 1a; Ludowici Ta; Tb; Tc; Tf; Tg; Tp; Tr; Ts; Tv; Tx; Ritt. 1; 1R; Walters 79;
2) under cups: Drag. 24; 24b; 25; 27; 27g; 27R; 33; 33a; 33e; 40; 46; Loes. 7; 11; 12; Ritt. 5; 5g; 8; 8g; 9; Knorr 78;
3) under bowls: Drag. 29; 29R; 35; 36; 37; 38; 42; 42sh; 44; Hermet 9; 24; Ludowici Sc; Sd; Walters 81; Vernhet E1; Ludowici Sb; Sh; Déch. 71.
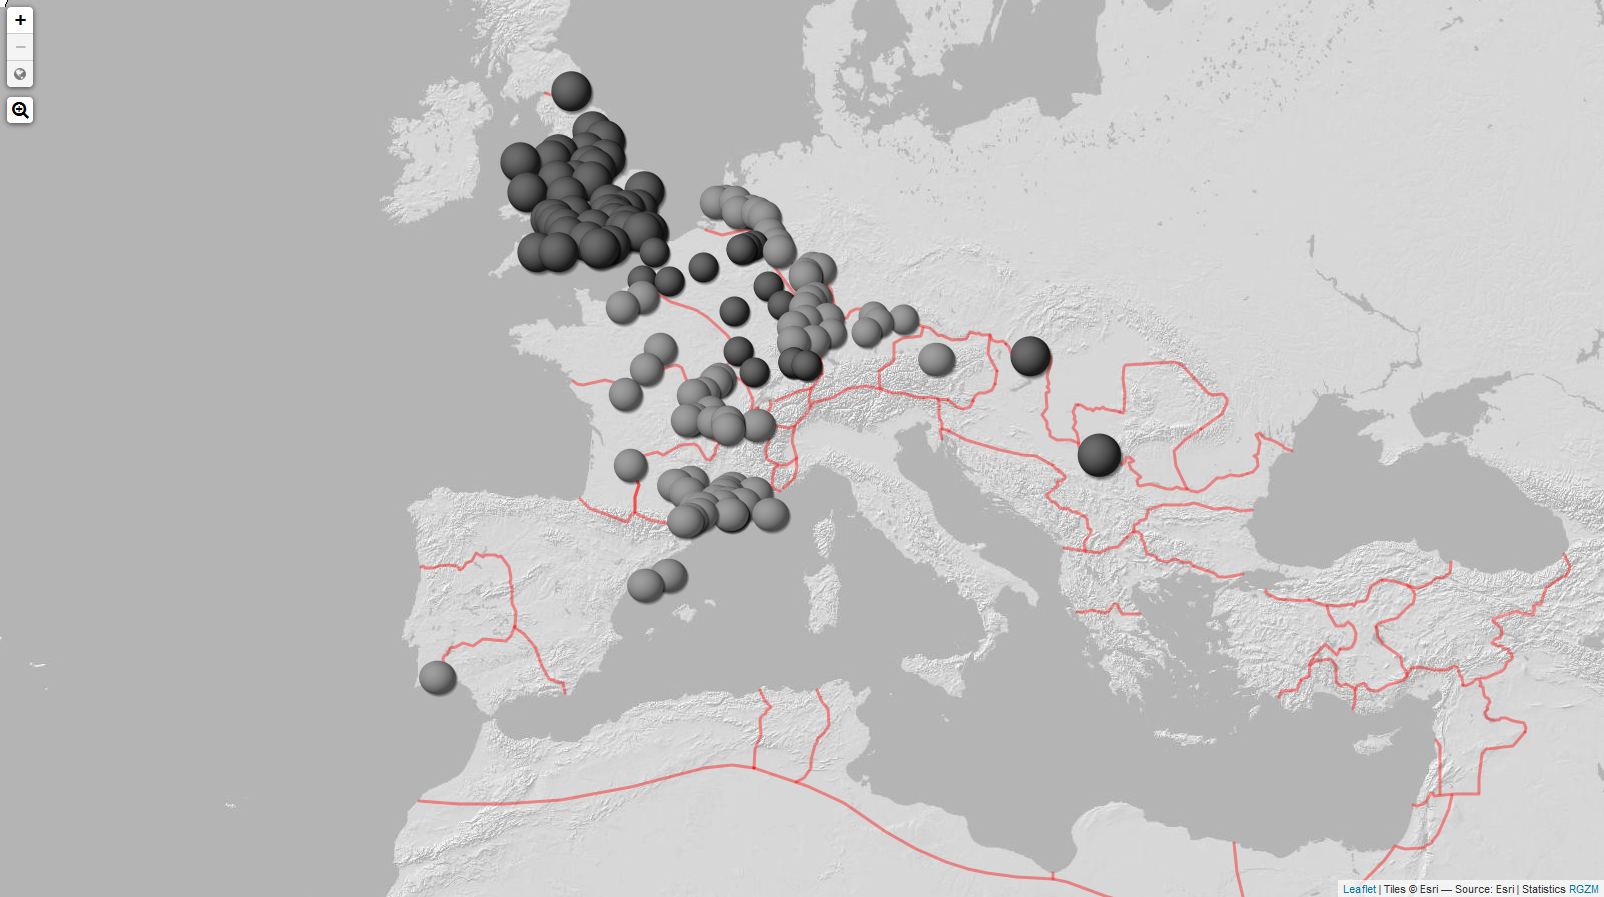
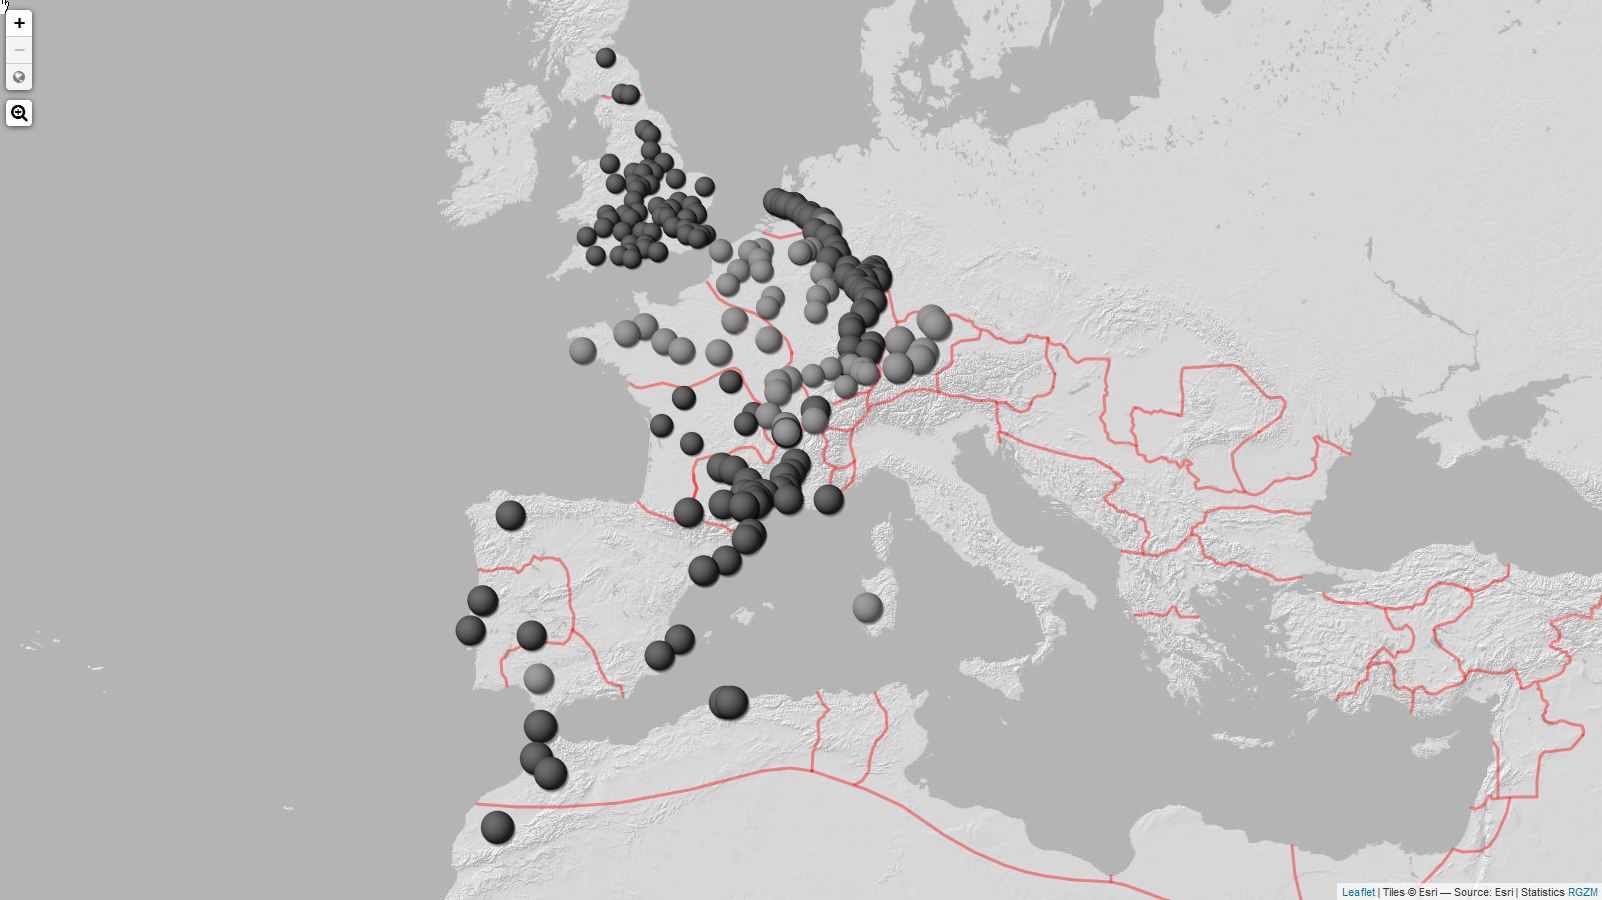
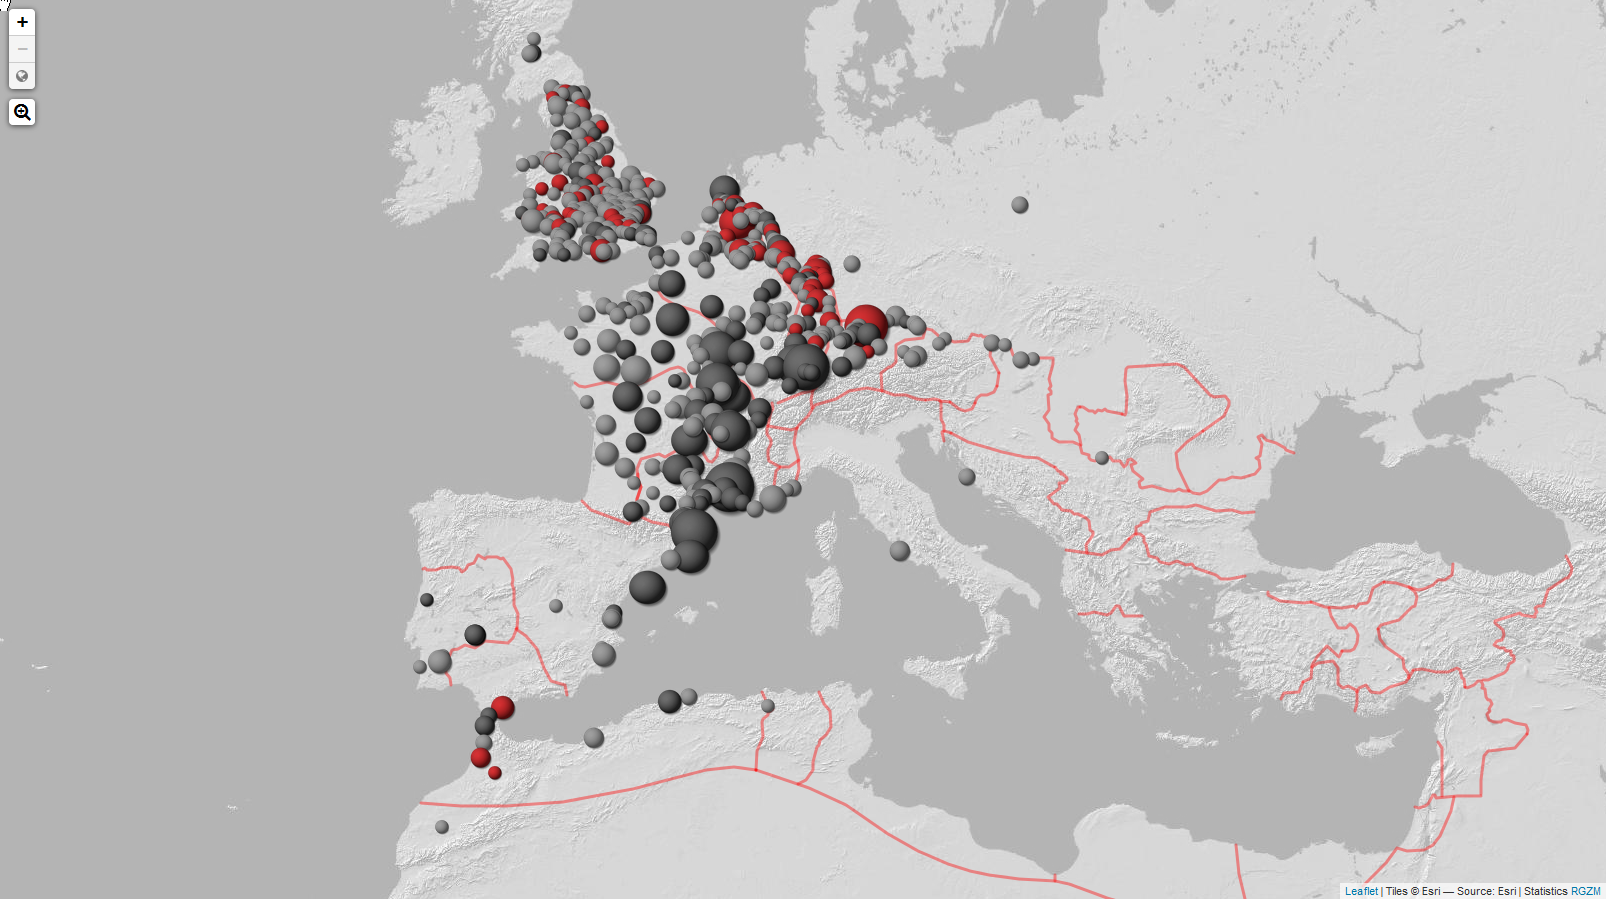
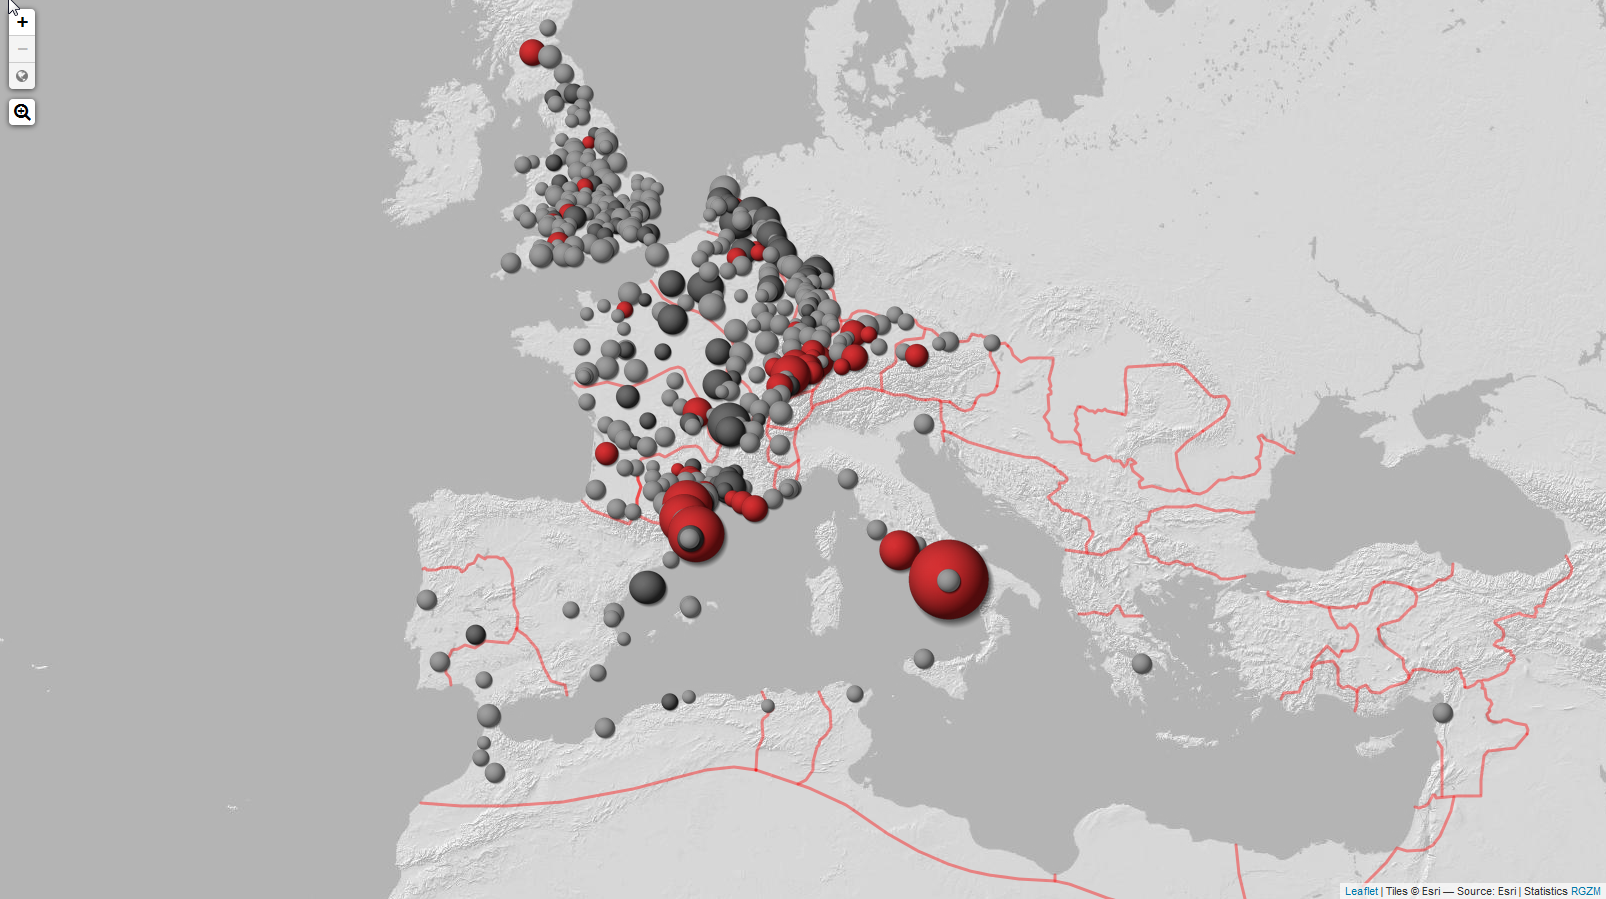
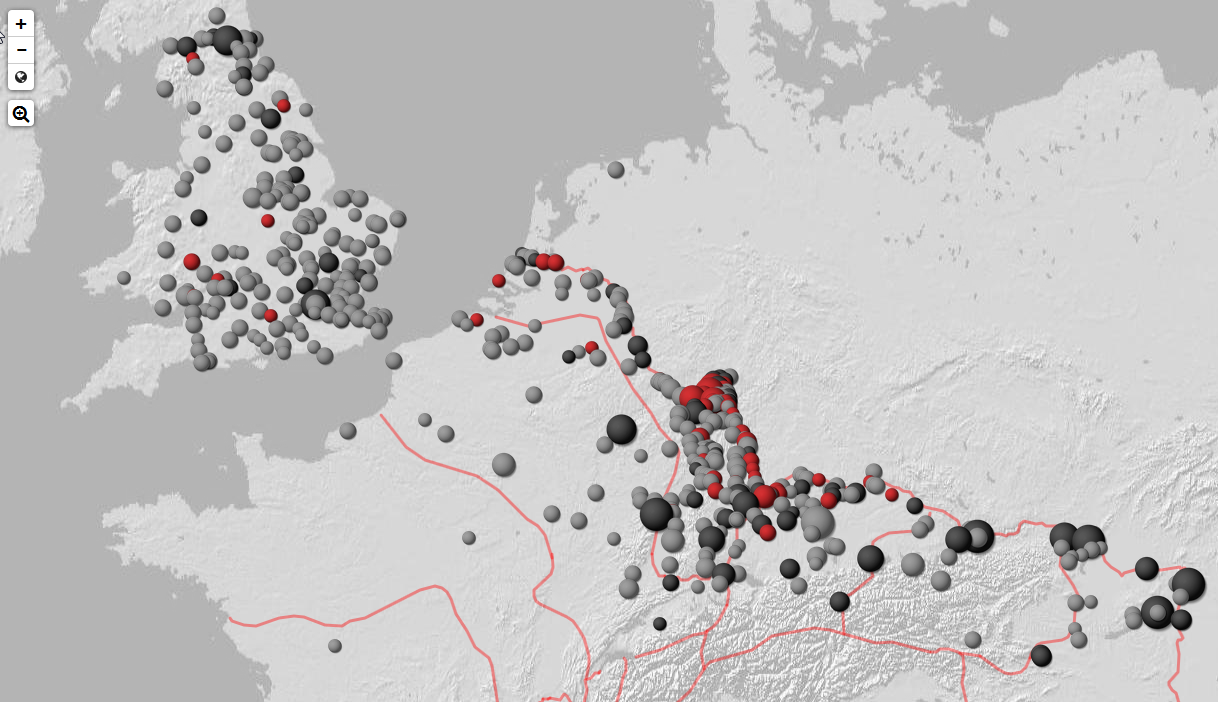
As an iron rule in Chi-Square statistics, sites that have less than five occurrences cannot be taken into consideration. They are displayed on the maps here as grey dots. As with all distribution analyses, large depots (see below), such as kiln sites themselves, have been taken out of the calculations. A distribution map with Chi-Square weighted find spots with dishes displays an interesting pattern where, surprisingly, dishes can be found more often than expected on British sites and similarly in Germania (Figure 18). For cups, the map does not suggest a clear centre of gravity within the European distribution (Figure 19). But it must be pointed out, however, that such generalised maps do not fully replace the analysis of single form distributions. For specific cups like Drag. 33, there are clear preferences visible, for example within British consumption sites (Figure 20). Also form Drag. 27 demonstrate very diagnostic patterns of consumption in Britain and the Rhineland (Figure 21). For bowls, there is a clear tendency for significant amounts towards the southern edges of the La Graufesenque distribution (Figure 22).
Thus it can be concluded that individual form types were indeed sold in different quantities in different, larger, regions of the empire. Therefore this broader pattern analysis will now be completed with an inter-site analysis on a more regional level.

There is also the matter of chronology to be investigated in these distribution patterns, since the first-century consumption patterns may have changed over time. A closer look at such maps using samian of the second and third century is very conclusive. While second-century exports of Lezoux towards the north-west part of the empire still show a preference for dishes in these areas (Figure 23), although somewhat less explicit, the second and third century exports of Rheinzabern show a very different pattern. Only in the early export period of Rheinzabern towards Raetia and Upper Germania (Mees 2002), is there a clear and recognisable preference for dishes in this area (Figure 24). This coincides with the massive military infrastructure projects started in this area for the so-called Vorderen Limes. However, the predominantly third-century exports towards the lower Rhine estuary and Britain do not show this preference any more. Therefore, it can be concluded that when dishes had a large market share in samian supply, and when huge regions of the Roman Empire are taken into account to avoid the problem of inter-site volatilities, dishes seem to have been associated with areas (not individual sites) that had a strong military presence.
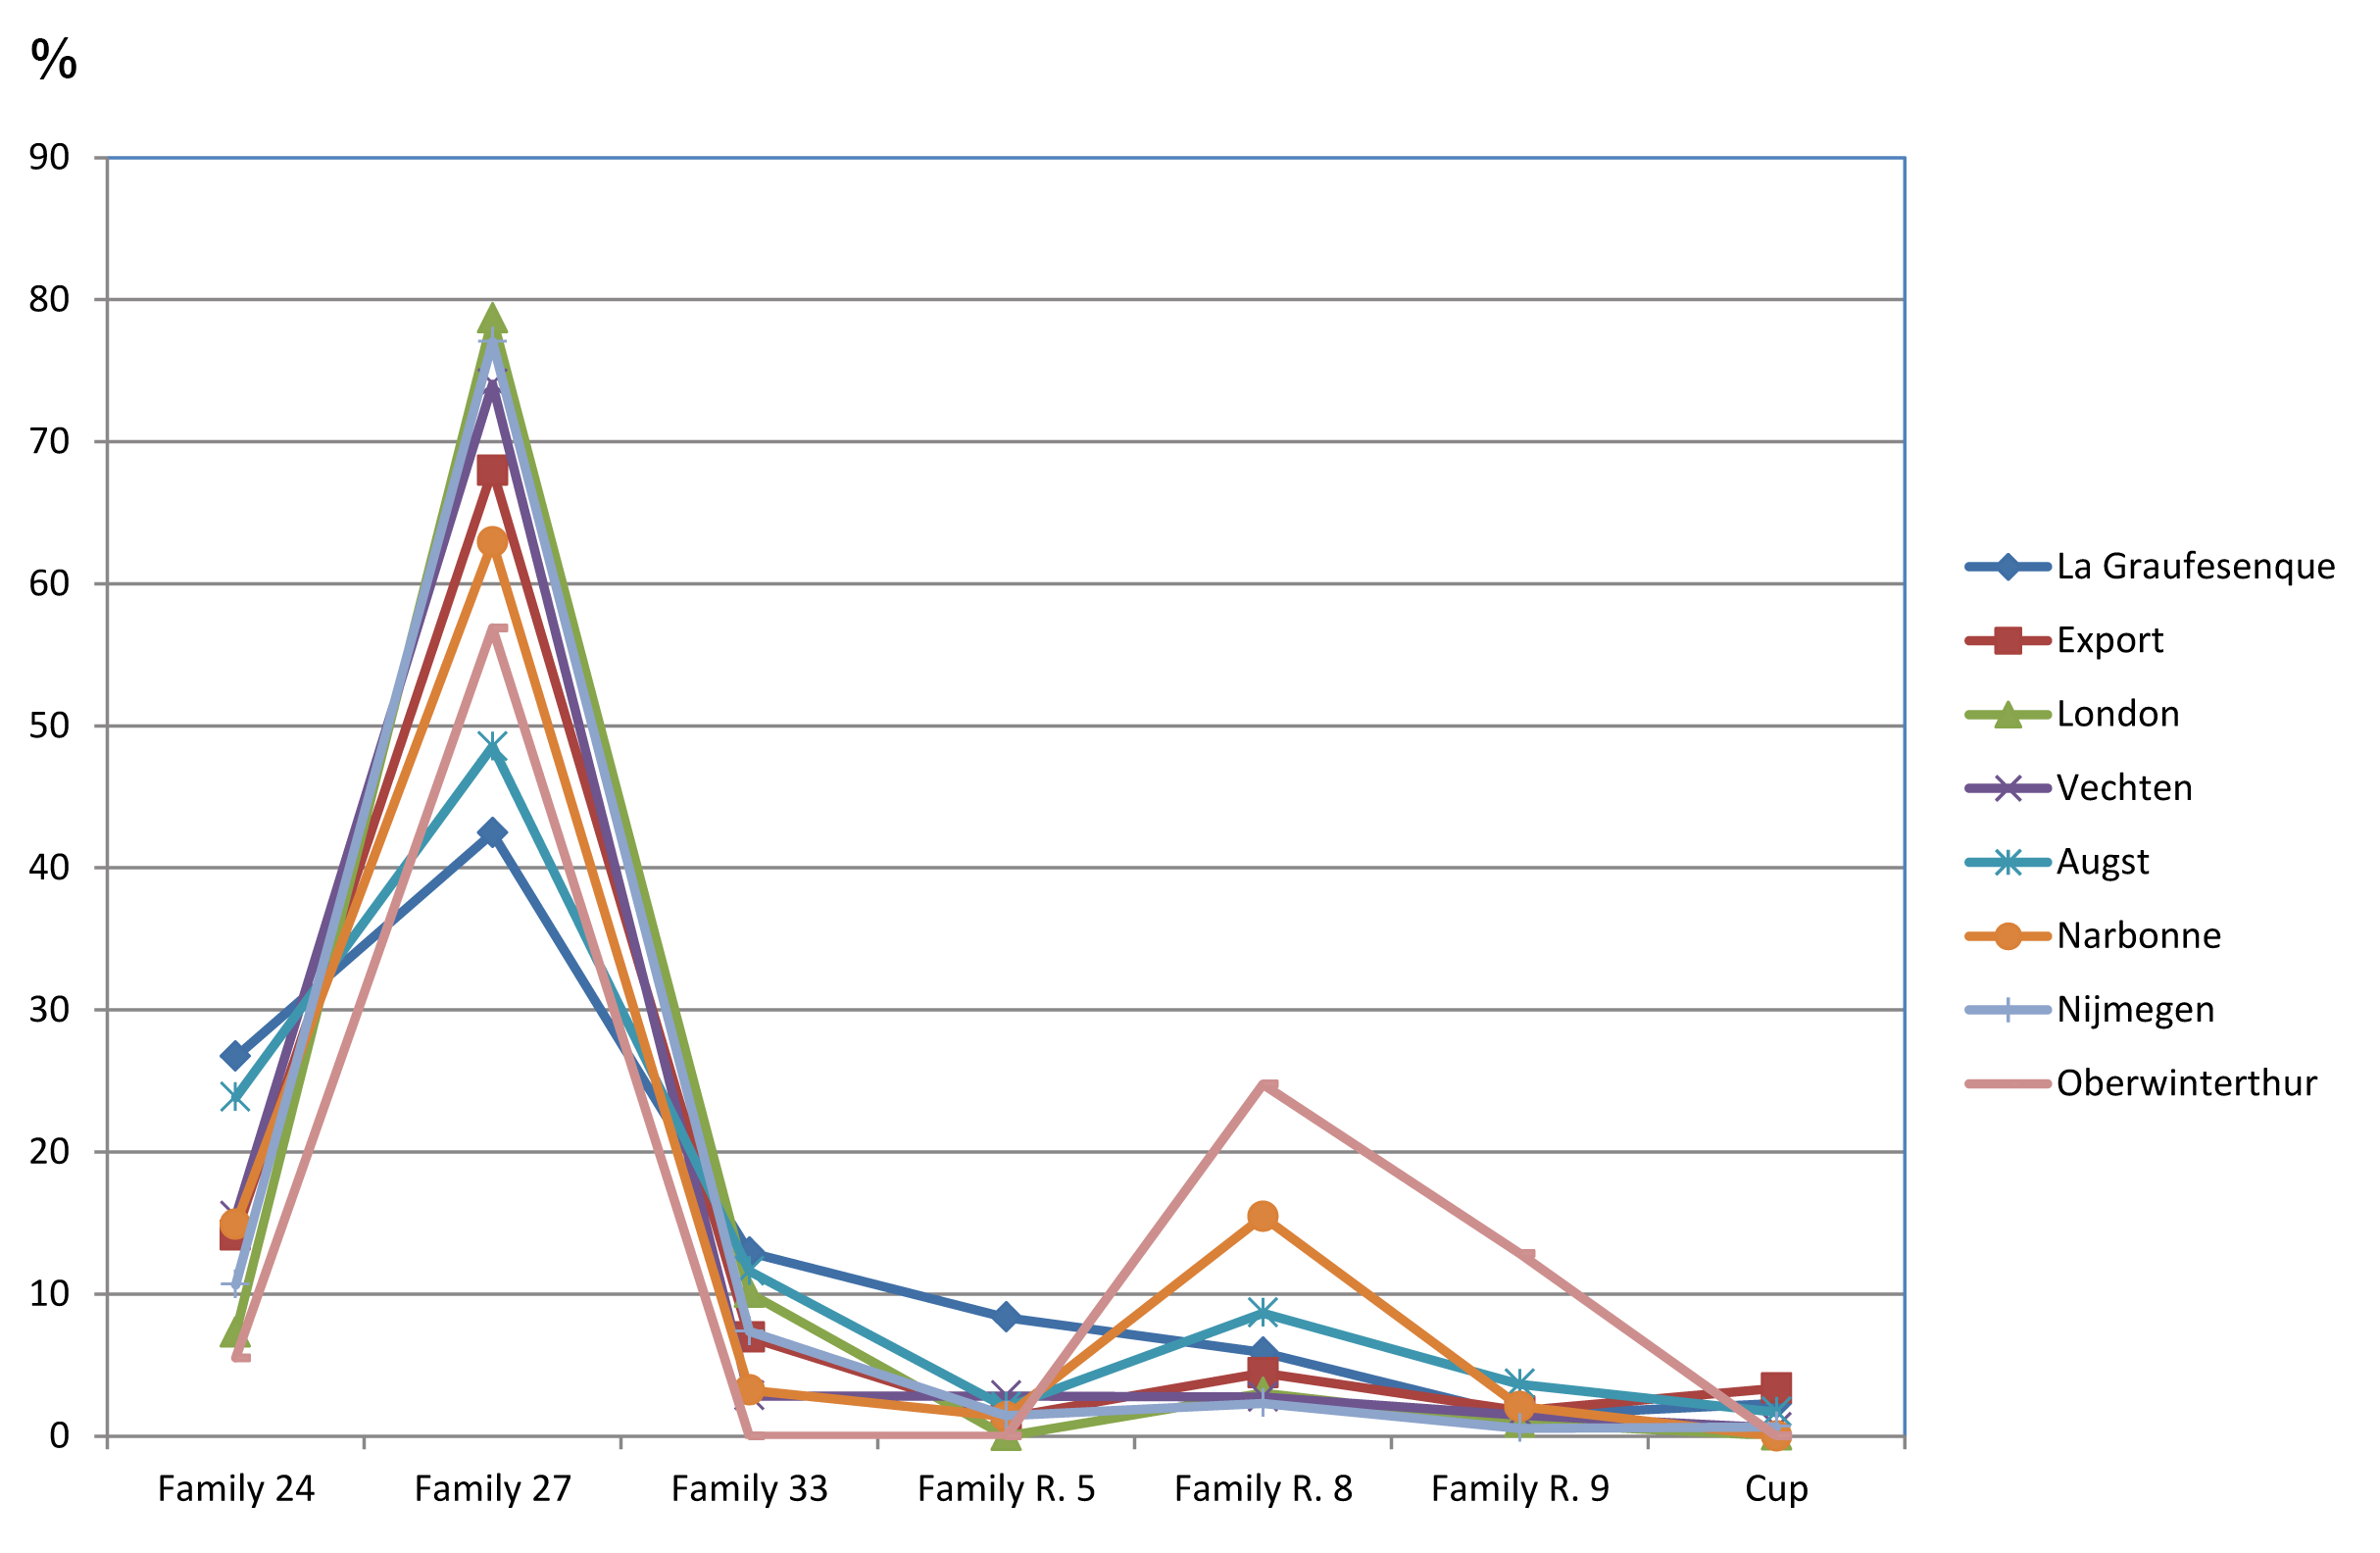
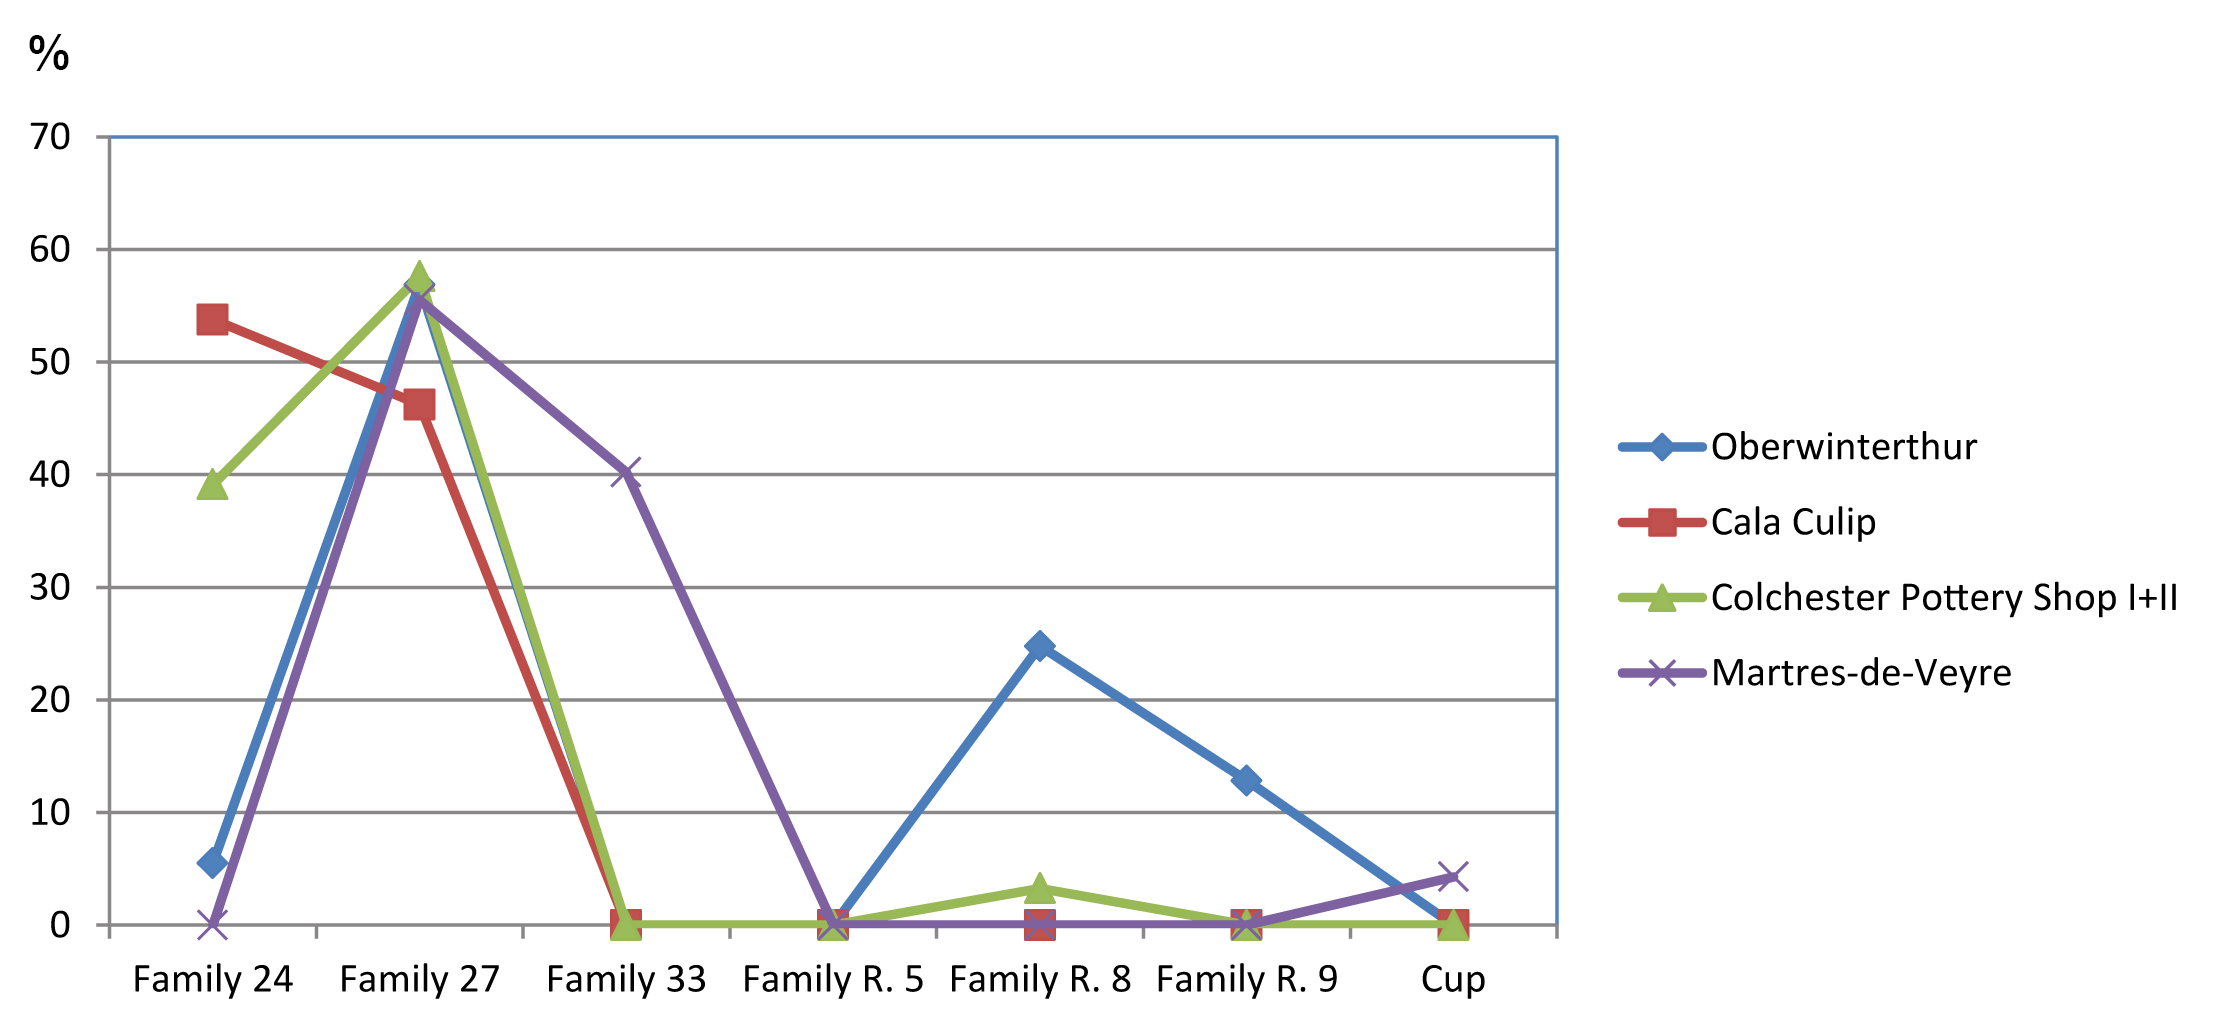
As argued above, comparisons between find groups from different consumption sites demonstrate a considerable volatility, even within the highly standardised samian industry market and should act as a warning against trying to reconstruct social environments – be it military or civil - by comparing assemblages from different sites, or even within sites. The presence of the omnipresent cup form Drag. 27, for instance, varies up to 40 per cent within different civil sites (Figure 9). The deviation within depot finds from any average distribution norm is even more remarkable. Depots like the Colchester Pottery Shop I and II, Oberwinterthur-Keramiklager or Cala Culip show, per form-type, even greater deviations between each other and from the average distribution norms (Figure 25). However, from a statistical point of view, this large variation is at first explicable by the significant lower numbers within these depots, compared with normal sites. But since this may also be due to time-specific reasons (certain pot-forms being produced more frequently during certain time periods), it is necessary to study changes in the general form proportions over time.
When we look at the timeline of pottery types that have been found on export sites, it becomes clear that apart from the obvious general rise and fall of production numbers at the beginning and end of the La Graufesenque kiln site, there are three general peaks visible in the consumption of samian in the Roman provinces (Figure 26). Whereas the first peak is noticeable around 40 CE and may be seen in relation to the increasing samian consumption in Gallia Aquitania at that time, the second, maximum, peak after 60 CE may result from the rapid reconstruction of Britannia following the Boudican revolt. Evidence from a wax tablet recently found in London datable to 62 CE - a year after the Boudican revolt - reveals precious details of the rapid recovery of Roman London (Tomlin 2016).
The third peak, from 90 CE onwards, may be related to the installation of the Limes in Germania Superior at that time. What is interesting, however, is that the general production increase in these periods was not limited to very specific forms, but affected more or less the complete production repertoire at La Graufesenque.
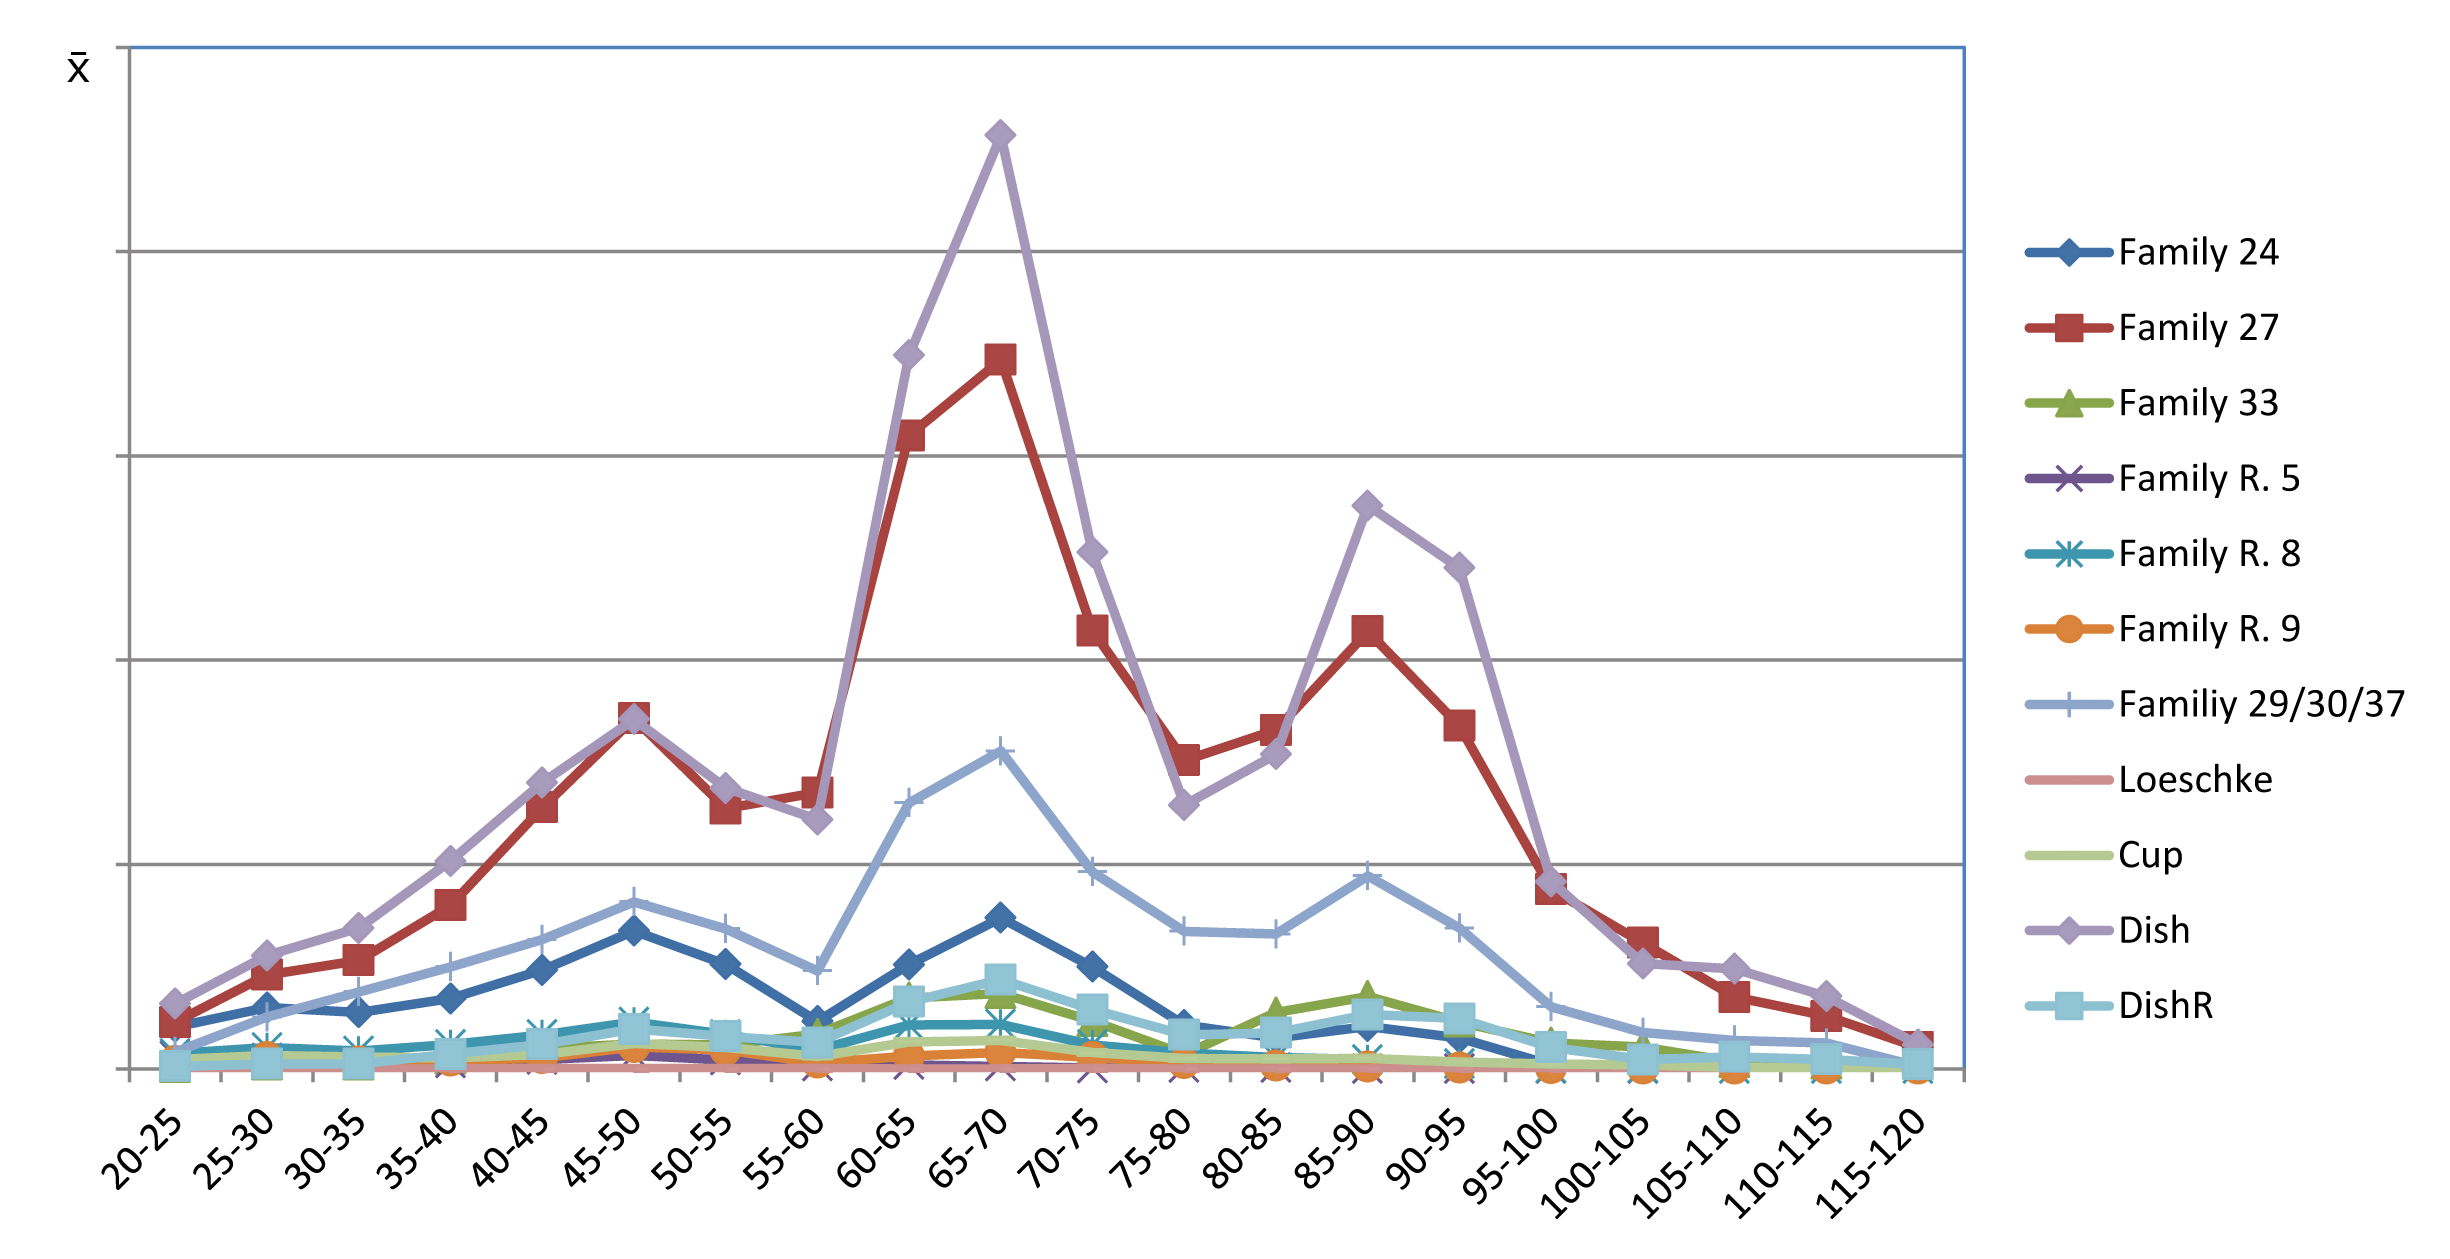
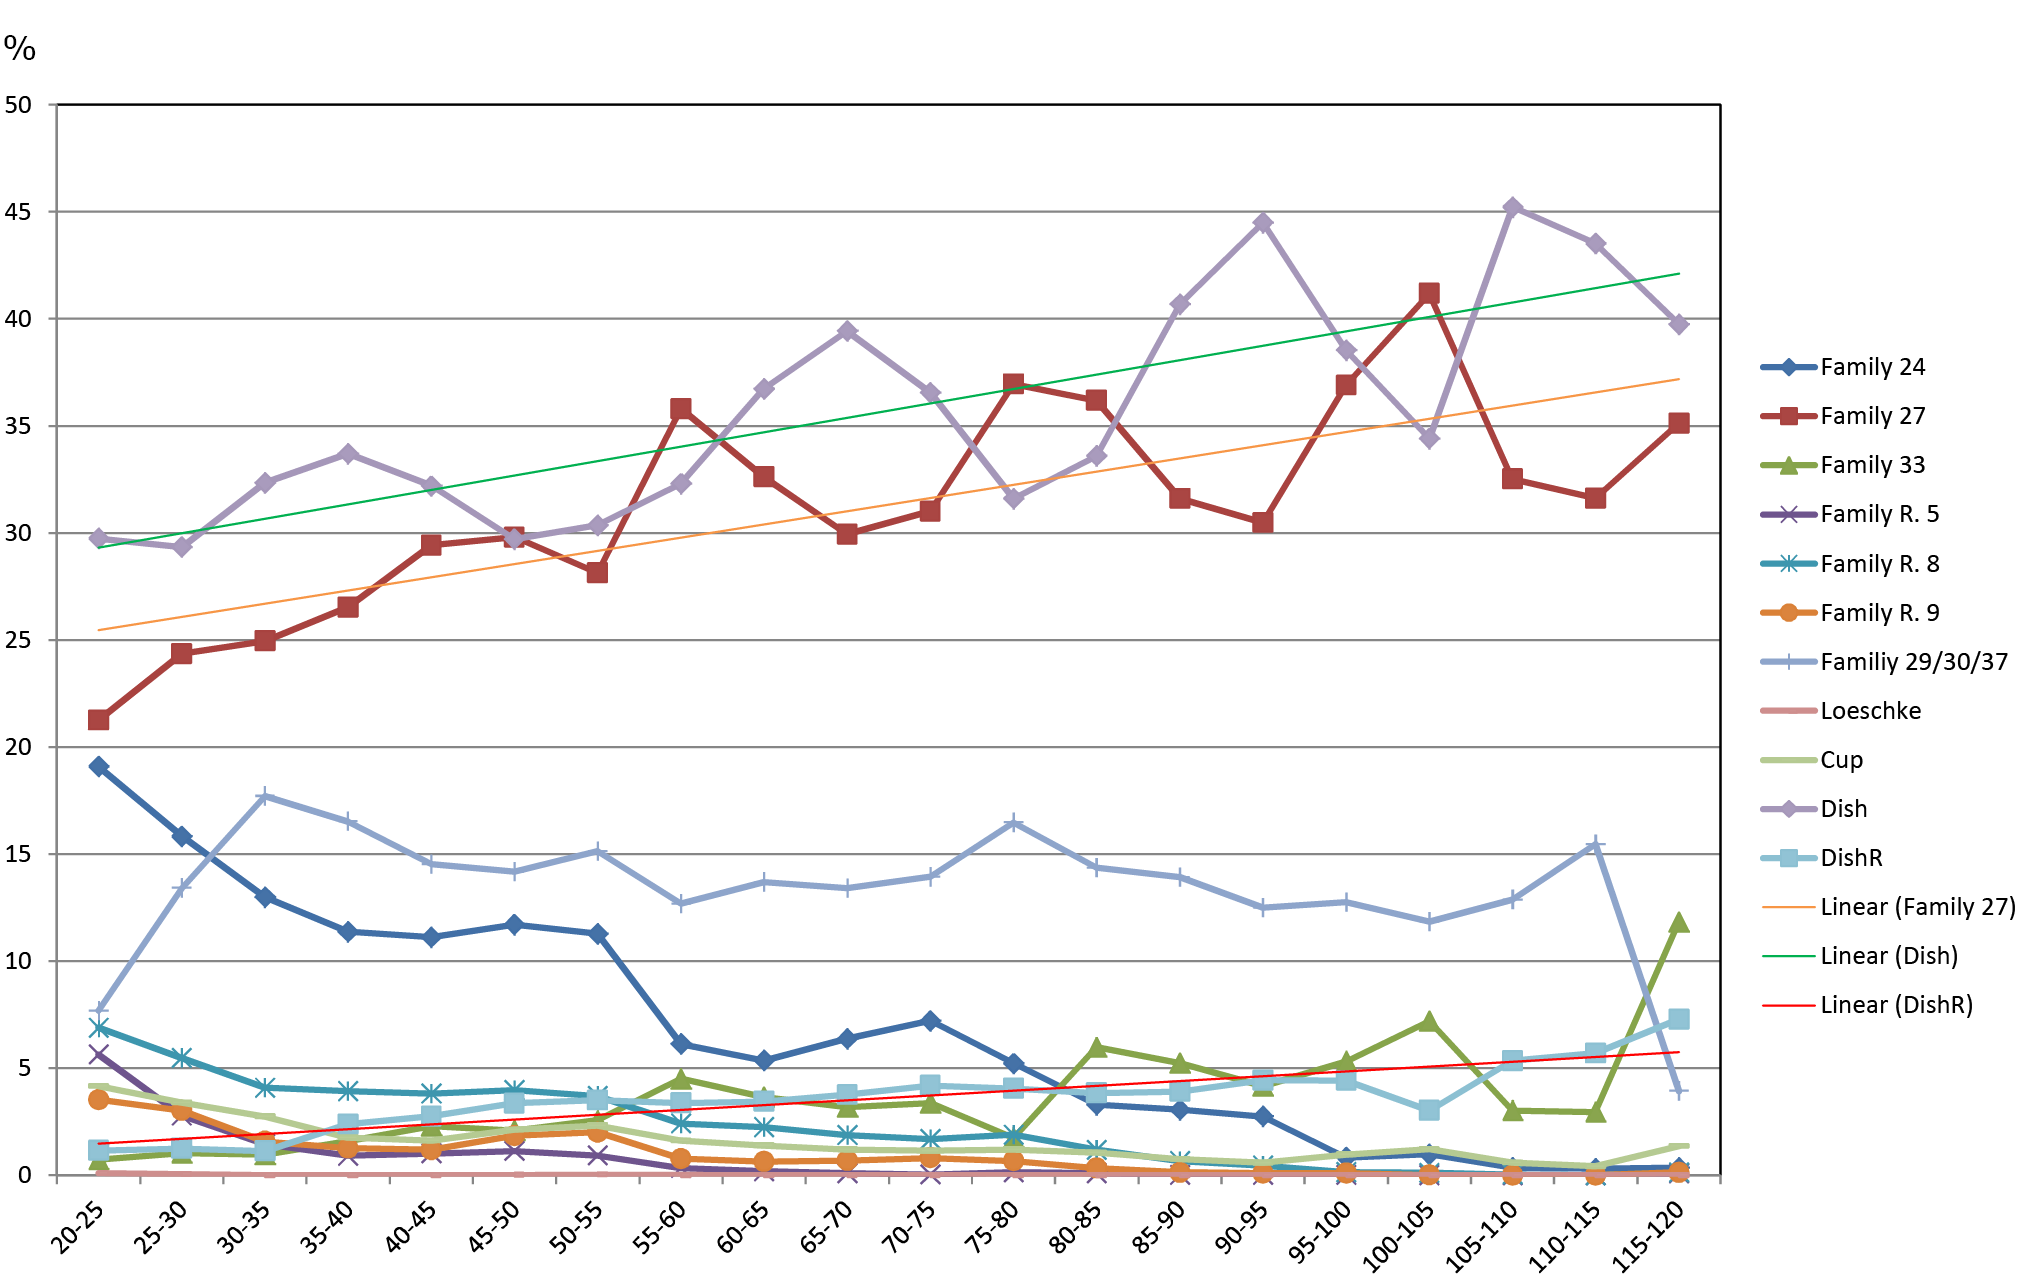
Thus, while there is already a huge volatility between individual site consumption, this volatility is even further amplified by the chronologically determined differences in output of cups and dishes. Throughout the first century, the output volume of dishes and Drag. 27 steadily increased, whereas other forms such as Drag. 24 faded away – at varying rates in different regions (Figure 27). The increasing importance of the large rouletted dish is also noticeable. An obvious explanation would be that this pattern may very well have been caused by a slow but steady change in drinking and/or eating habits in the provinces during the first century, causing cups to be slowly driven out of the market by larger forms such as beakers (cf. Dannell this volume). It is also interesting to note that the massive thinning out of the range of forms at La Graufesenque from the Flavian period onwards does not really seem to have influenced the continuously changing dining habits in the consumer market (Vernhet 1976). On the contrary, this Flavian cost-reduction programme seems to have been a kiln-site specific adaptation to keep its products in the market. However, since a considerable part of this new Flavian product line remains unstamped (which particularly involves form Drag. 35/36), much of this development remains below the radar of the current research datasets, which are based on stamped vessels only.
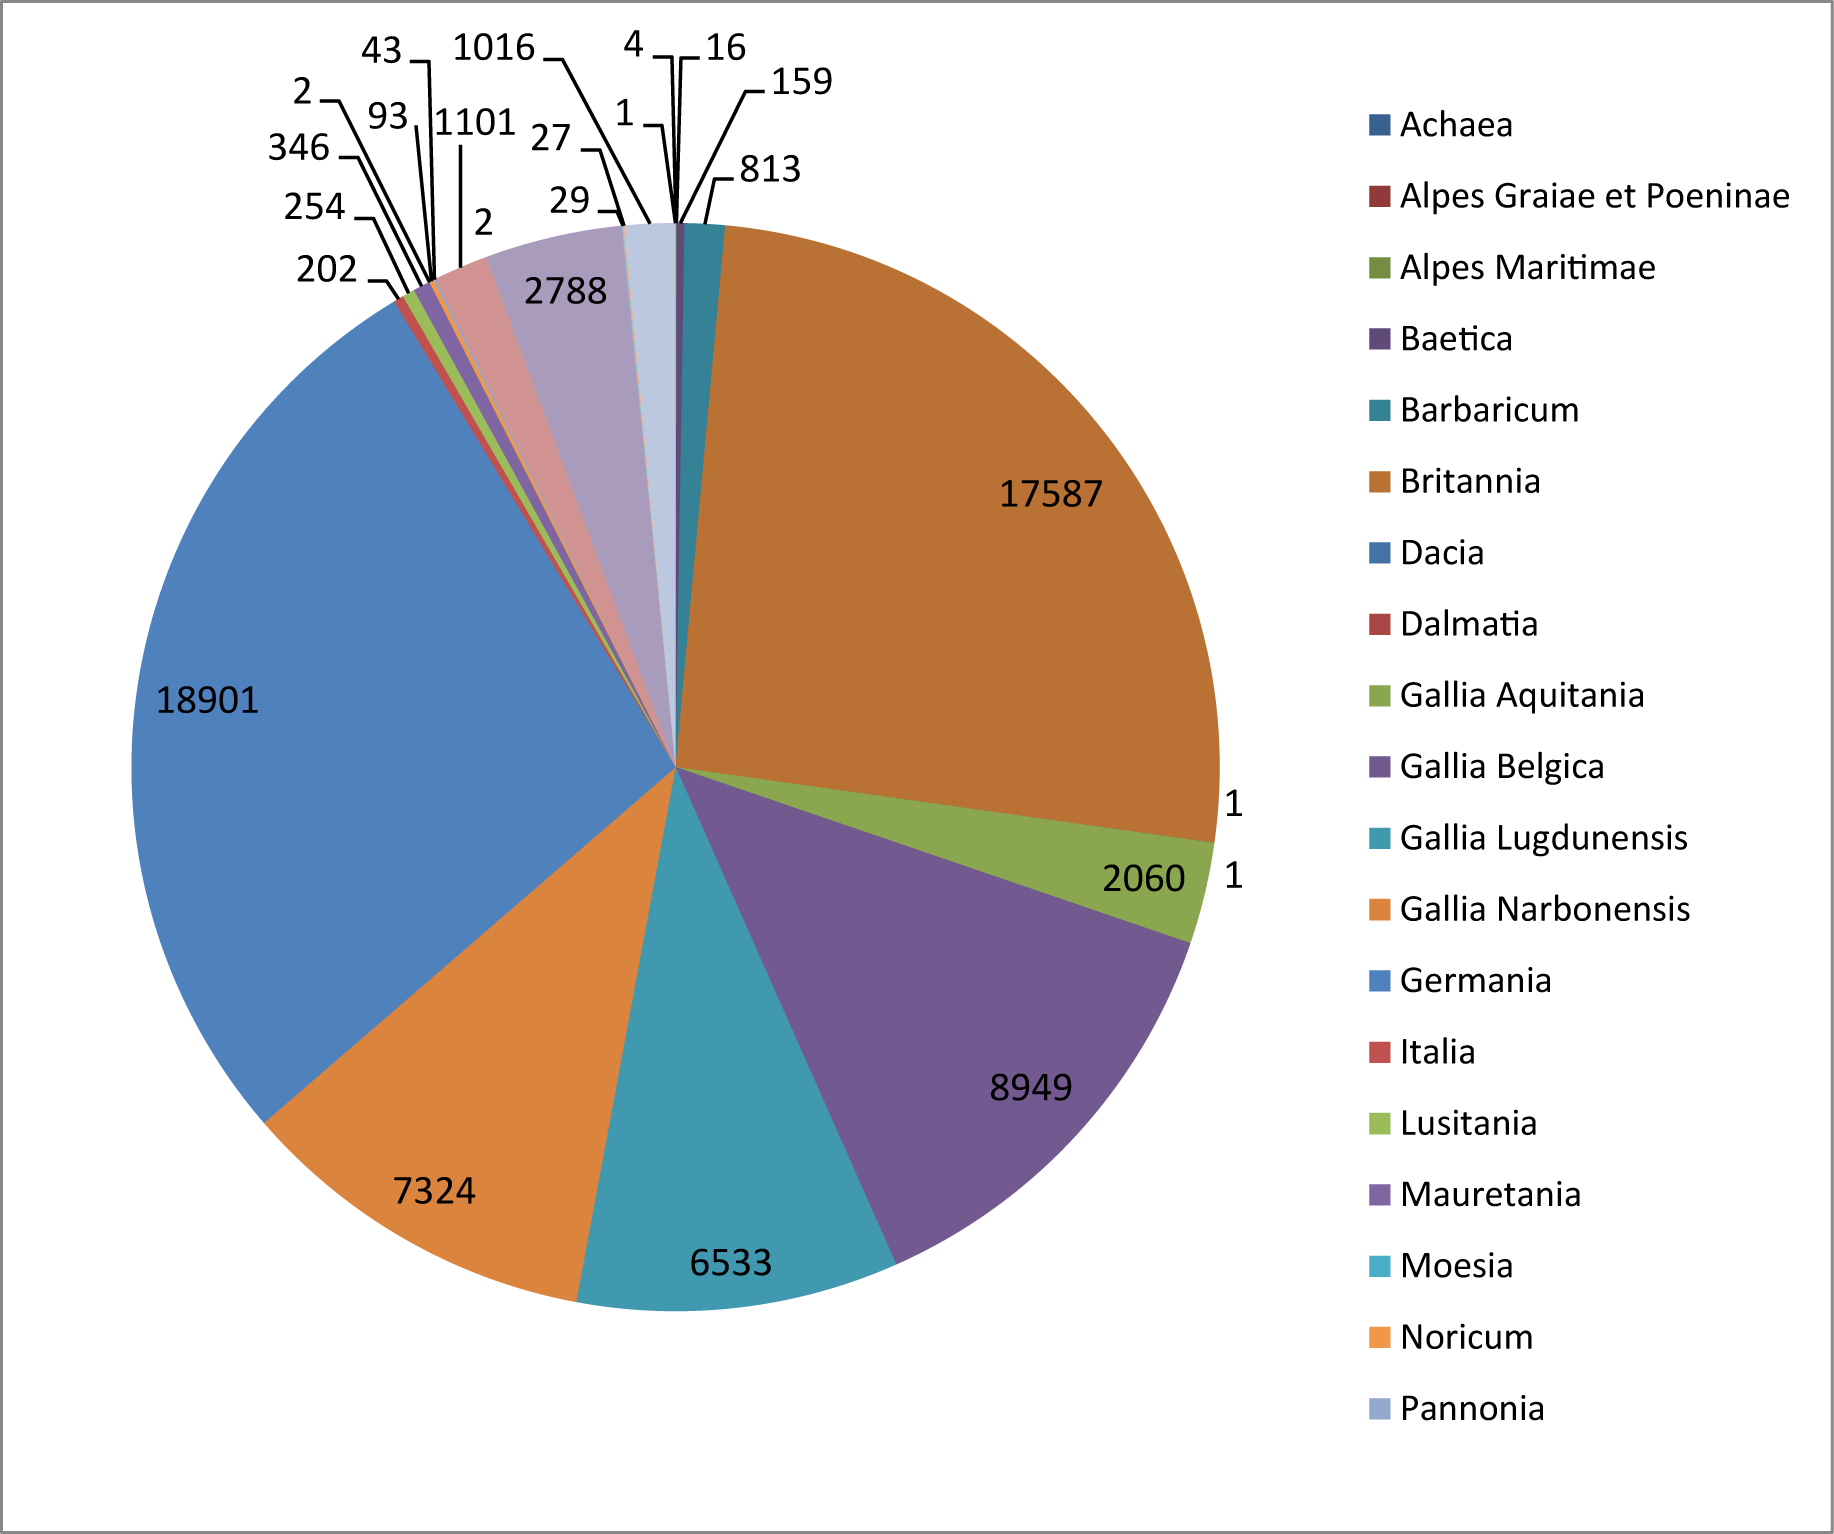
The influence of the provinces of Britannia and Germania on the quantities contained in these graphs should also not be forgotten: the respective pie slices demonstrate the large amount of samian that each province was importing (Figure 28). Therefore, any change in consumption patterns in these provinces – e.g. the occupation of Britain, the Batavian revolt, military campaigns in Germania etc. - will be reflected in significant changes within the time curves.
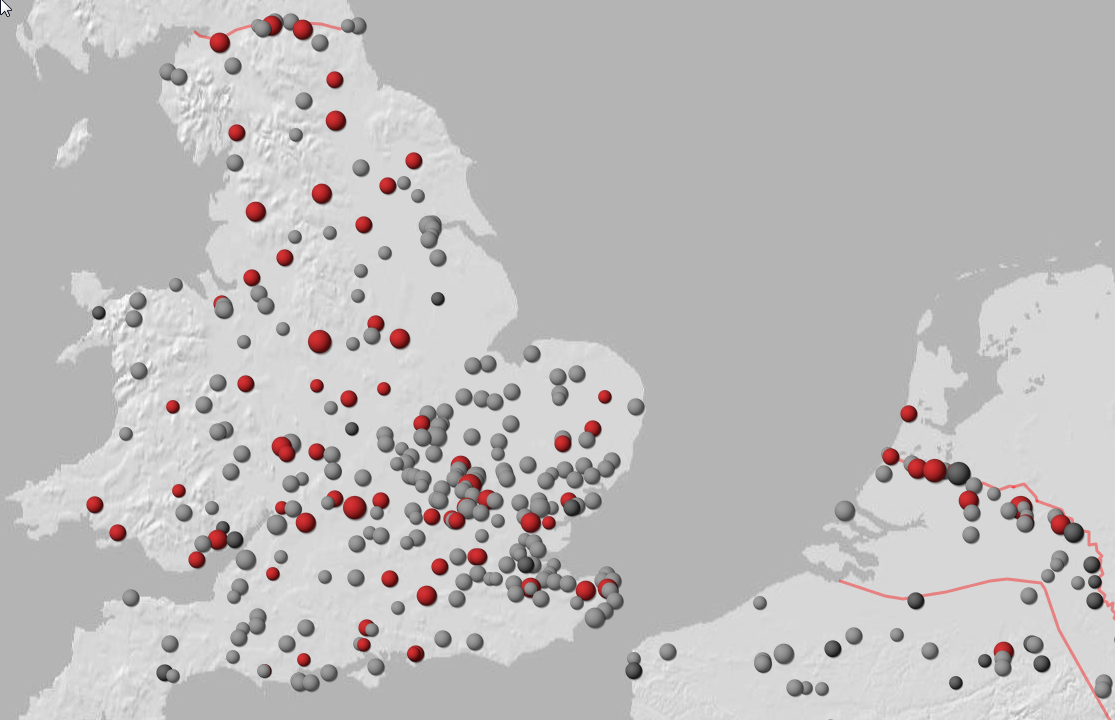
A close up of the aggregated dish distribution for the first century for Britain and the Rhine estuary informs us that, in Britain, there is at first sight no clear distinction between military and civil sites, whereas in the lower Rhine area and its hinterland, there seems to be a clear dichotomy (Figure 29). Military sites like Vechten in the Netherlands do not have significant numbers of dishes, whereas civil sites like Rochester in Britain have remarkable quantities. Therefore any theoretical dichotomy between civil and military sites, based upon the frequencies of samian ware, cannot confirm such a dichotomy; the statistical variation is simply too large. Another factor is probably that most civil sites, like farms and little villages, simply do not provide enough material to allow evaluation on a statistically sound basis. There is certainly a significant difference visible between dish usage at the Rhine with all its military components and the hinterland of Gallia Belgica with its absence of military components. The lack of clearly distinguishable 'military regions' in Britain suggests that one can only arrive at statements concerning 'military type of consumption or not' if one takes huge European areas into account. Such areas may even comprise multiple legionary districts, suggesting that a direct military involvement of a single military commanding structure is extremely unlikely. In theory, very fine-grained data that can be confidently attributable to very specific social groups and with big enough sample sizes might give a clue, but such samian datasets have hardly been analysed yet.
This seems to reinforce the hypothesis that there was no centralised legionary/military purchasing policy for samian - as shown by the evidence of amphora distribution, organised within the annona (Ehmig 2003). Large variations in the composition of samian types on individual sites as opposed to the general background mean that at the moment it is not possible to carry out analysis on less than a supra-regional approach and only with classes of vessel, rather than individual forms.
The result of this analysis is thus pointing towards a repudiation of the concept of any 'military market' for samian. This is caused by the nature of the research material involved: archaeological material marketed on a supra-regional level apparently can - if at all - only display differences between supra-regional spectra. In the case of form Drag. 24 disappearing in Britannia by around 70 CE, it was still massively exported to the Mediterranean area after 80 CE, as evidenced by the shipwreck Cala Culip. Due to the correction in the dating of large parts of the German Limes, which resulted in a later dating by c. 20 years, the former dating of the Cala Culip shipwreck in the 80s should now be considered as superseded, since this largely depended on the dating of the German Limes (Mees 1995, 62; Hartley and Dickinson 2001; Kortüm 1998). Samian seems only to allow for making supra-regional changes in consumption visible. Similar conclusions were made with a study on the second and third century samian from Rheinzabern in the relatively smaller, but still large, Danube and Rhine export markets (Mees 2002, 165).
The matter of numbers is also relevant for other dating work that was done with samian. The slowly changing proportions between 70 and 90 CE of the decorated forms Drag. 29 and 37 has been regularly taken as a method to establish a detailed chronology. Sites with Drag. 29 only were generally considered as pre-Flavian, whereas find spots having Drag 37 only were thought to be founded in the Hadrianic period. A supposed linear change in proportions during the intermediate 20 years would then lead to a detailed chronology. However, this kind of study did not take into account that these decorated forms were relatively rare compared to the (in this period) abundant forms Drag. 18, Drag. 31 and Drag. 35/36, and hence there was an automatically underlying high volatility (Pferdehirt 1986; Mees 2011, 274). Any chronology based on such rare forms must therefore be considered highly suspect.
The per contra of this is, that if one has a reasonable amount of material from a specific site at hand, the chances are good that one can conclude from a blind sample from which region in the north-west Roman Empire this sample of samian stems. It all ends up with what the French 'ceramic experts' would call supra-regional facies (Lepot and Brulet 2007) or what German colleagues would describe as Keramikprovinzen (Mees 2002, 165), but within such large regions, statistics seem to prohibit conclusions concerning comparison of individual sites, let alone differences between rural and military sites. It remains to be seen, however, whether the diagnostic buying power pattern found on a micro-level within a military camp itself (see Figure 8) can be confirmed by further future research on intra-military camp analysis. For measuring differences between individual sites - be it civil or military - within a single Roman province or smaller region, samian really is not the right material to use.
Internet Archaeology is an open access journal based in the Department of Archaeology, University of York. Except where otherwise noted, content from this work may be used under the terms of the Creative Commons Attribution 3.0 (CC BY) Unported licence, which permits unrestricted use, distribution, and reproduction in any medium, provided that attribution to the author(s), the title of the work, the Internet Archaeology journal and the relevant URL/DOI are given.
Terms and Conditions | Legal Statements | Privacy Policy | Cookies Policy | Citing Internet Archaeology
Internet Archaeology content is preserved for the long term with the Archaeology Data Service. Help sustain and support open access publication by donating to our Open Access Archaeology Fund.