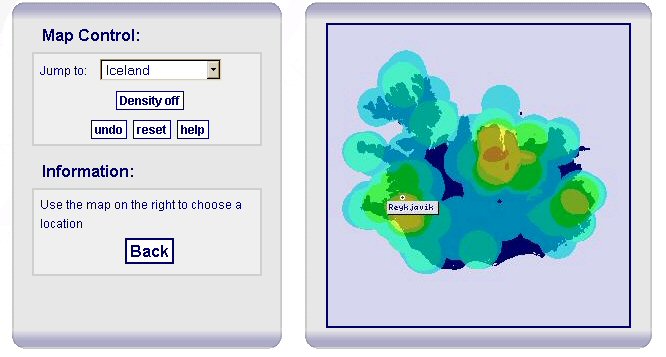
Figure 6: Screenshot demonstrating the ARENA Where search, showing record density for all periods in Iceland
This section is co-authored with Stewart Waller who designed the ARENA search interface at the Archaeology Data Service.
The ARENA spatial search uses MapServer, an open source web-GIS package used for map-based browsing on the 'Where' option. MapServer was chosen because it is an open source application and could thus be relied upon into the future, unlike many other proprietary software packages. There were a number of technical problems encountered with this option because the portal was already using ColdFusion as its online database.
MapServer has no support for ColdFusion; it is primarily a stand-alone common gateway interface (CGI) application. This makes it difficult to share session variables (data selected by a user during a particular session in an online resource e.g. the ARENA portal search) with the rest of the ARENA portal application. All data manipulation has therefore been handled using JavaScript. To enable dynamic features, such as the click-hold-drag bounding box, JavaScript was again the only solution. Where possible, this has been written to comply with the various DOM (Document Object Model) standards employed by recent browsers such as Internet Explorer, Netscape, Mozilla and Firefox. However, various issues have been noticed in some versions of less supported browsers such as Opera.
The mapping available in the ARENA spatial search relies on available map sources. In the case of the ARENA portal, as an educational resource created by a higher education institution (the University of York), the university licence allows for the use of Bartholomew's maps. These form the underlying map base for the search portal. Given better map availability, even better presentation is possible in such applications. As is often the case, the presentation of GIS application is not only reliant on good data but on a good map base too.
The density layers are basically shape files based around tiff images. The tiff images can be created using ArcView or ArcGIS using the 'calculate density' spatial extensions. These tiff images have then be sliced/tiled to lessen the amount of data that needs to be analysed for a specific area.
Figure 6: Screenshot demonstrating the ARENA Where search, showing record density for all periods in Iceland
The ARENA interface used a 'rainbow effect' colour map (see Figure 6) to represent various levels of density. However, as long as each layer uses the same settings, anything could be used.
The ARENA search map does not show a legend to decode what the various colours represent. This has been omitted for the purposes of the ARENA project as some project partners had very much greater numbers of records than others. If the interface had used the same gradient for each country, some partners would not have shown any records at all in certain regions even though a limited number do exist. This is the nature of density plots. For this reason, the gradient was customised to display an aesthetically pleasing/even spread across the whole Arena area per period.
© Internet Archaeology/Author(s)
University of York legal statements | Terms and Conditions
| File last updated: Tue Sep 27 2005