Back
|
Forward
|
Close this Window
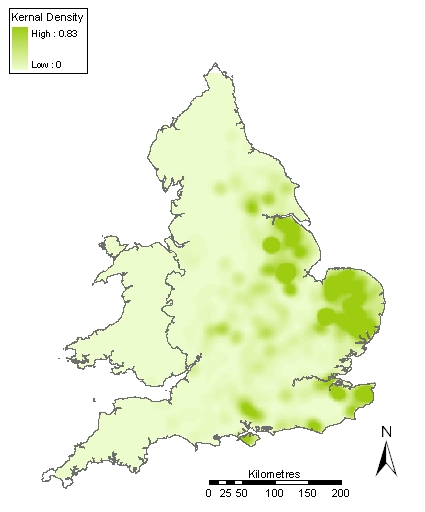
Figure 43: Kernel density plot of PAS Early Medieval finds