Back | Forward | Close this Window
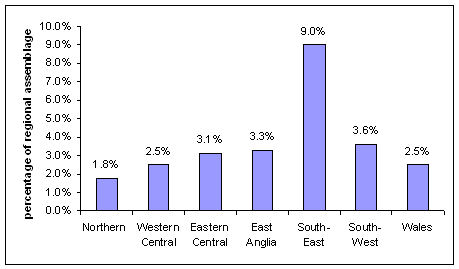
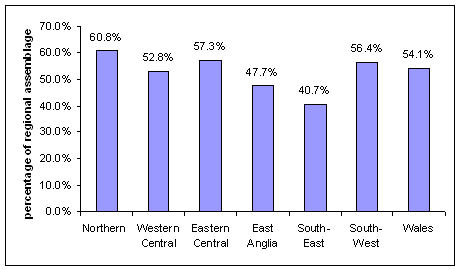
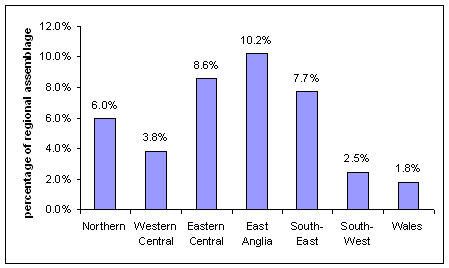
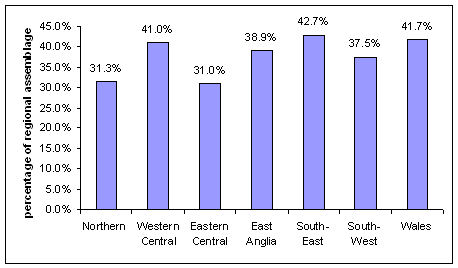
Figure 47: Charts showing period assemblages by region, calculated as a proportion of overall regional assemblage (from top to bottom: Iron Age, Roman, Early Medieval, Late Medieval)