Back
|
Forward
|
Close this Window
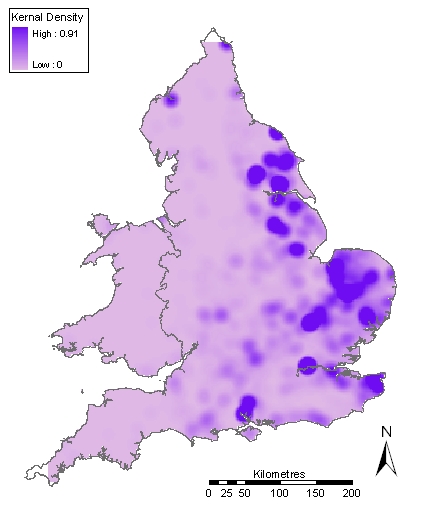
Figure 53: Kernel density plot of EMC data