Back | Forward | Close this Window
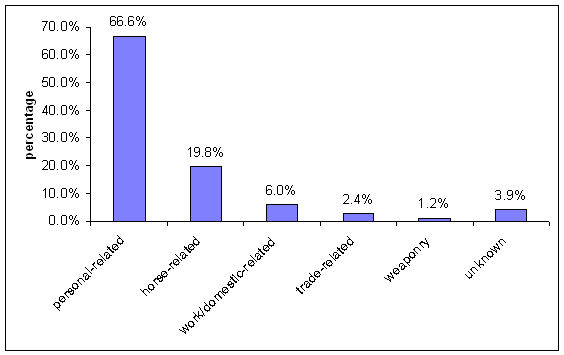
Figure 62: Chart showing PAS finds categorised by functional group