Back | Forward | Close this Window
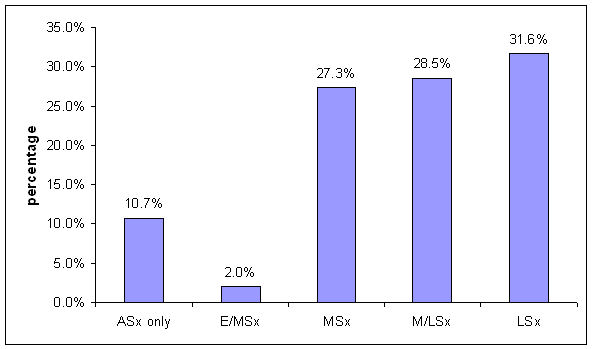
Figure 70: Chart showing proportion of PAS finds in northern England categorised by broad period