Back | Forward | Close this Window
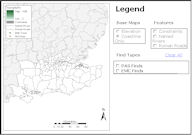
Figure 85: Interactive map of PAS and EMC data in south-east England