Back | Forward | Close Window
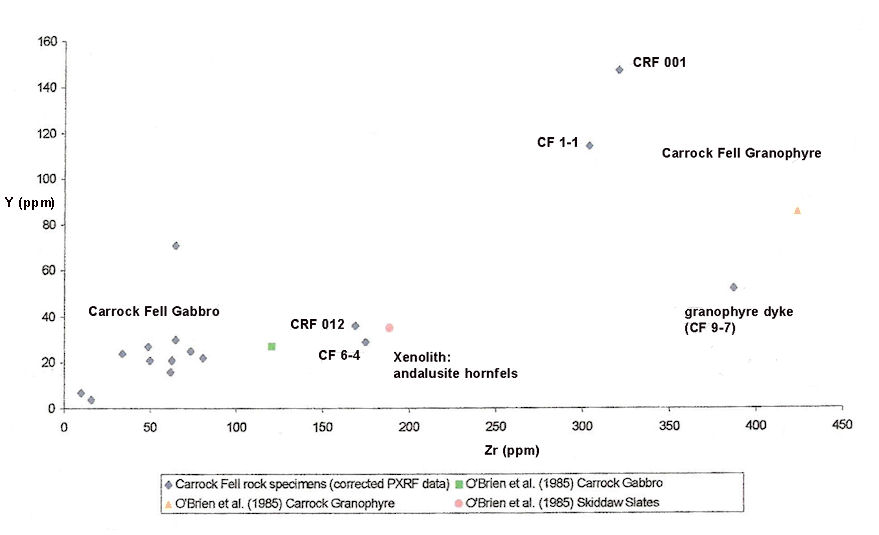
Figure 3: Zr v Y plot for Carrock fell (corrected PXRF data) to illustrate geochemical clustering of different rock types within the Carrock Fell Complex.