Back | Forward | Close Window
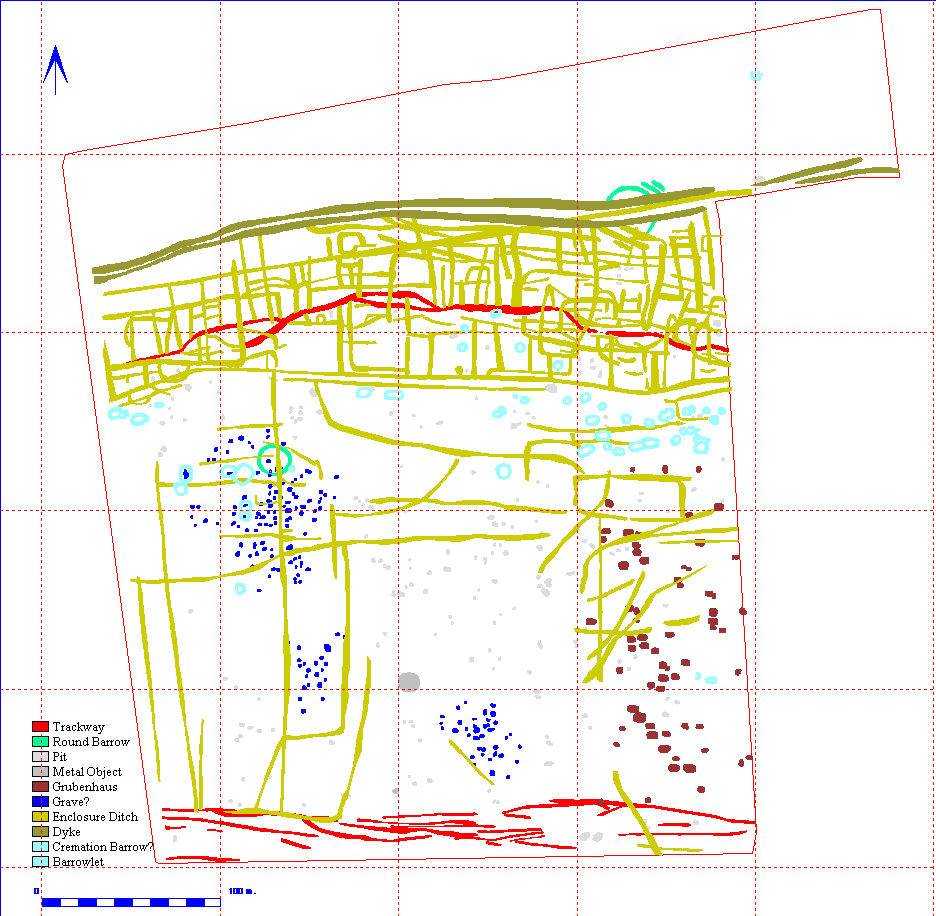
Figure 4: Classified feature plot for Site 28 showing the distribution of features on the basis of initial interpretation.