Back | Forward | Close Window
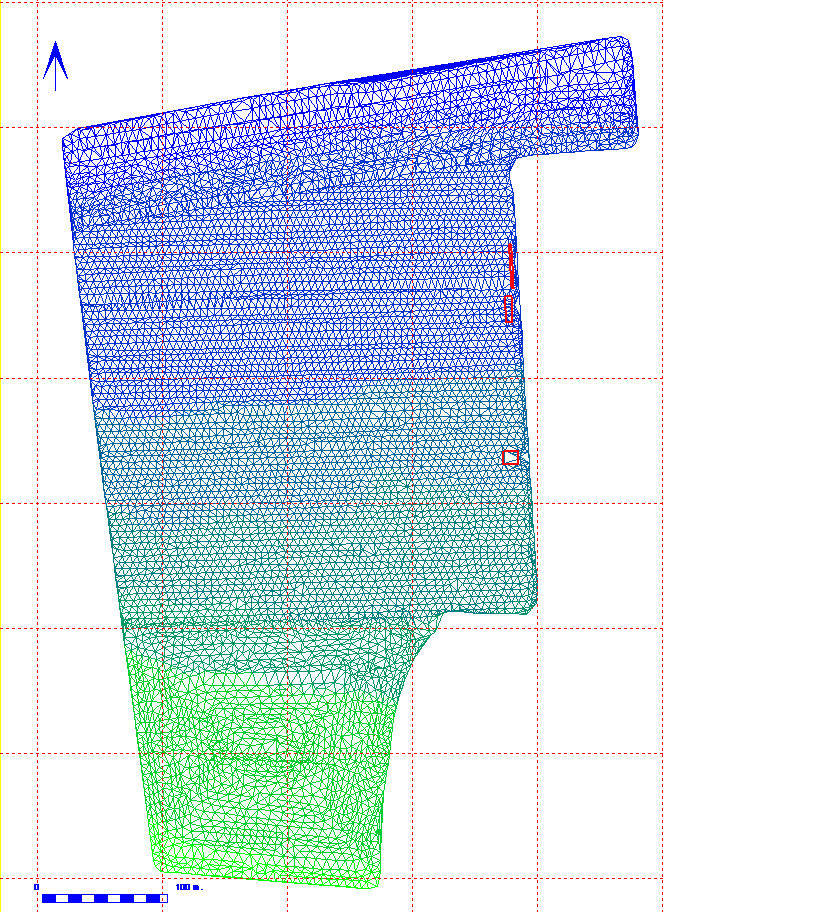
Figure 6: TIN model showing the results of the Delauney Tessellation with the trenches marked in red. The triangles are coloured to reflect the elevation change from the lowest in blue in the north to the highest in green at the south.