Back | Forward | Close Window
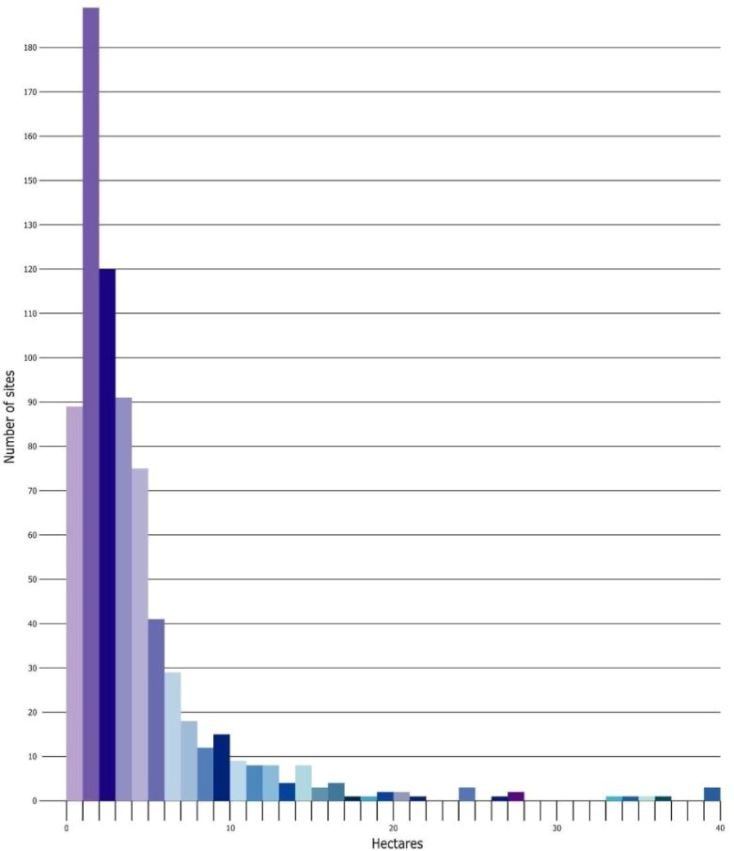
Figure 6: Bar chart showing the range and frequency of main internal area in hectares.