Back | Forward | Close Window
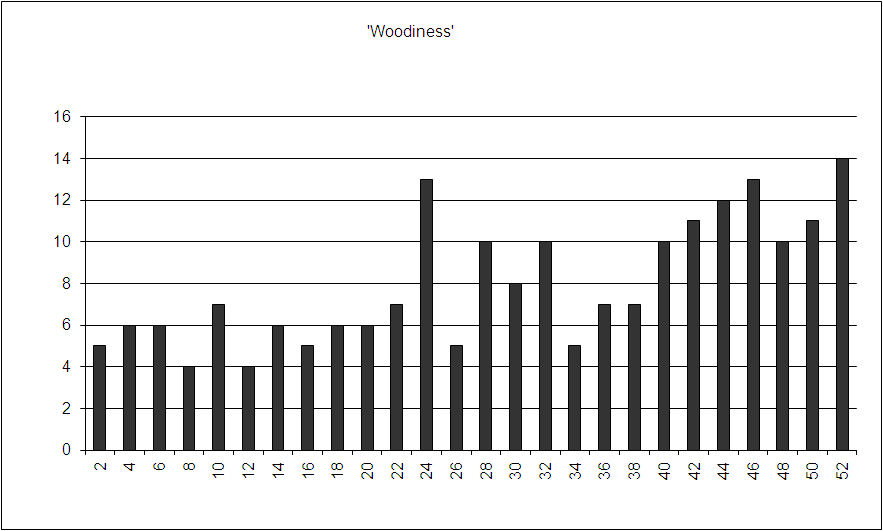
Figure 15: Sums of abundance scores for identifiable taxa and other components (wood, bark) representing trees and shrubs. Y-axis: sums; X-axis: sample numbers.