Back
|
Forward
|
Close Window
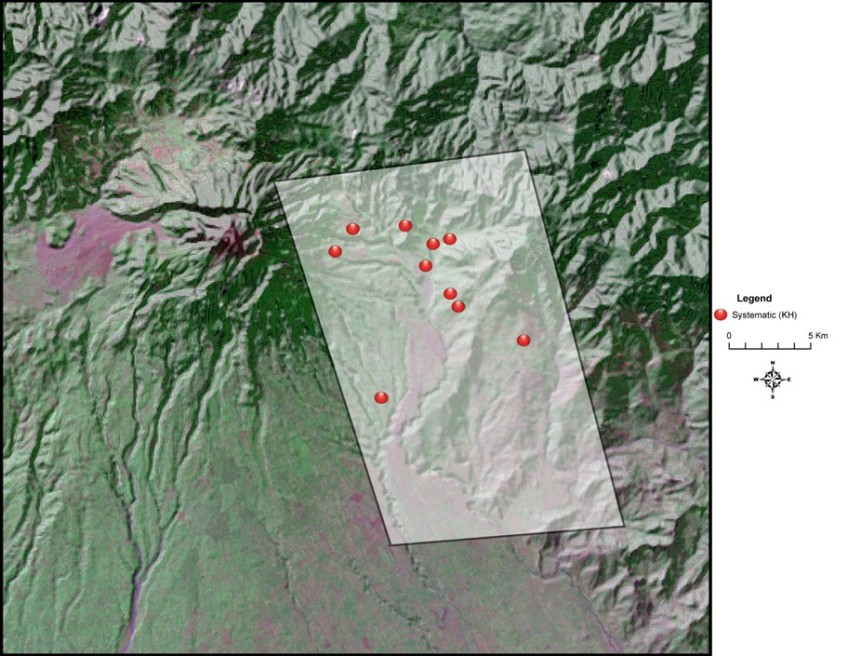
Figure 33: Map of 2000-2005 study area.