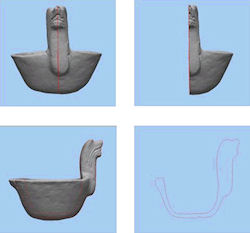
Figure 6: Cross-sections can be generated from a variety of angles to produce profiles at any direction or axes.
The development of high-resolution 3-D models provides for what we may describe as remote or virtual analysis. In this case the digital representation is studied for various metric or stylistic properties using either automated tools and/or human vision. Different digital representations (e.g. PDF, OBJ meshes, point clouds) support different types of analytical operations. It is significant that there is a growing body of literature that suggest that 'simple' point clouds may be the most desirable data format for many analytical and representational purposes (Kobbelt and Botsch 2004). We first discuss the broad range of analytical operations possible and then look at how they are implemented in specific software. Throughout these discussions it should be noted that, in general, features that are larger than 0.2 mm can be expected to be measurable from the digital representation.
The measurements that can be taken include:
There is a wide range of both free and commercial software that supports these and other measurements. These include the free Rapidform Explorer (available for download) as well as the full commercial versions of Rapidform, Polyworks, 3D Reconstructor, Geomagic and others. Free or open source software permitting analysis of OBJ file data includes the Pointtools data viewer and MeshLab. Video 3 shows the application of the measurement tools in the free Rapidform Explorer as applied to an object from the Hampson collection.
The digital versions of the objects facilitate a number of innovative analyses that were not possible before. These include quantification of roughness, slope, and degree of curvature. Angle measurement tools provide the means to measure rim-bevelling angles precisely in ceramic analysis, a measure that is difficult, if not impossible, to determine using traditional physical tools. The ability of this measurement tool to further rim bevelling research is increased significantly by the potential to automate such data extraction.
Cross-sections can be generated from a variety of angles to produce profiles at any direction or axes. Cross-section tools are ideal for measuring wall or feature thickness in a specific area or to analyse thickness variability around an entire object (Fig. 6). This provides a means of research in defining variation within an object, between objects, and between collections of a variety of vessels. These cross-sections can be exported to other software for use in illustrations or further analyses. It should be noted that for many objects the cross-section provides for the exterior surface only, since the scanner cannot physically image the interior of many objects — such as a jar or bottle with a small mouth. In other cases, open bowls for example, the cross-section includes both interior and exterior.
Figure 6: Cross-sections can be generated from a variety of angles to produce profiles at any direction or axes.
Colour stripping options have the ability to reveal fine, small-scale surface features on a variety of object types, exemplified by the incising on a shell artefact in the Hampson Collection (Fig. 7) It can also be used to reveal the details of carving and grain on wooden objects, as can be seen from a wooden figure from Amarna (Fig. 8).
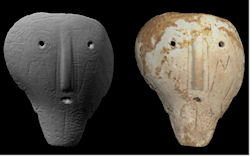
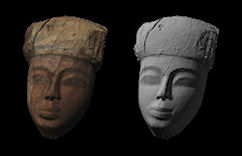
Figure 7: Example of results of colour stripping of shell object from Hampson collection.
Figure 8: Example of results of colour stripping of wooden figure from Amarna. [View object record in ADS]
Once the colour has been removed it is possible to arbitrarily locate a virtual illumination source to illuminate the surface of the 3-D object. A common application is to simulate a raking light to bring out subtle surface features. This process also facilitates 'hill shade analysis' and helps to accentuate surface features. Figure 9 illustrates the effect of a range of two virtual illumination angles on a shell artefact from the Hampson collection. Video 4 provides a more comprehensive sense of what is possible. As can be clearly seen in the video, the surface of the shell was incised. Particularly striking is the 'inverted W' shape seen just below and around the eye. This 'weeping eye' motif is a significant one in the eastern US during late pre-Columbian times.
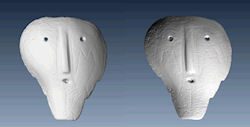
Figure 9: Effects in varying the virtual illumination on colour-stripped point cloud.
The effect of use of multiple/movable virtual illumination sources provides many (but not all) of the analytical and visual analysis opportunities of polynomial texture mapping (Earl et al. 2010). Since its development in 2000 by HP Labs, polynomial texture mapping (PTM) has grown in its value and application in the heritage community. While there are useful texture analysis options in PTM the three-dimensionality of the textured point cloud provides for analytical operations that are not available in PTM. For example, point cloud software tools can be used to reveal a number of surface treatments on ceramics including fine etching and dimpling.
One specific example of an analysis that can only be applied when a true 3-D dataset is used is curvature mapping. This is a numeric method that identifies significant changes in the direction of a surface — comparable to dramatic changes in the slope of a topographic surface. An example would be where an incised line appears on the surface of a vessel. Curvature analysis is particularly useful in the study of figures that were incised into pottery vessels prior to painting and firing (Fig. 10, adapted from Cole 2008).
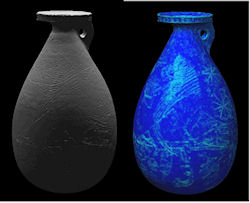
Figure 10: Examples of curvature mapping.
This tool can be employed to investigate manufacturing techniques and stylistic details that are otherwise obscured by paint or the object's material colour.
Another type of surface treatment analysis can be achieved through detection and isolation of relief features. For example, features such as relief ceramic motifs can be identified as either ridges and/or valleys that can then be extracted from the vessel and viewed in isolation for ease of investigation and precision measurement (Fig. 11). If desired, such motifs can also be projected onto a plane or other primitive object.
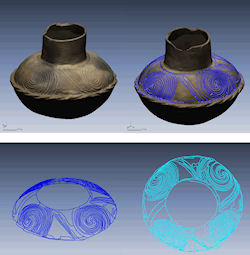
Figure 11: Feature extraction. [View object record in tDAR]
Alternatively, motifs can be extracted through selection of similar colours (Figure 12).
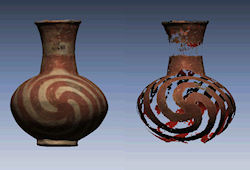
Figure 12: Motif extraction. [View object record in tDAR]
Isolation of such motifs can allow for traditional rollouts (such as those generally used for publication). Using additional software, however, more precise measurements can be achieved through 3-D investigation. Additionally, 3-D investigations of such motifs (as opposed to traditional rollouts) can allow retention of spatial integrity for comparative analysis among vessels of various types and sizes. Until now, researchers have not had the ability to quantify and analyse variables such as spiral tightness, proportions, etc. accurately in 3-D space. There are many tools in the point cloud software solutions that allow precise metric comparison of one object with another. These tools can be very useful in assessing the consistency of objects that were produced in industrial or other large volume settings — such as Roman ceramic vessels.
The comments facility has now been turned off.
© Internet Archaeology/Author(s)
University of York legal statements | Terms and Conditions
| File last updated: Tue Jun 28 2011