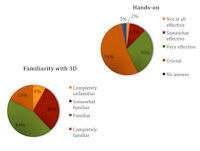
Figure 8: The graphic on the left demonstrates students' familiarity with 3D representations; the graphic on the right shows students' appraisal of hands-on activities

Figure 8: The graphic on the left demonstrates students' familiarity with 3D representations; the graphic on the right shows students' appraisal of hands-on activities
The results of the formative assessment showed that most students were familiar with 3D representations and considered visual and hands-on activities very effective or crucial for their learning. As a result, we thought that students were prepared to engage in a 3D digital hands-on activity (Figure 8).

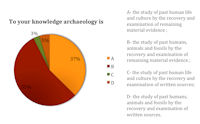
Figure 9: This graph shows students' background knowledge on archaeology at the beginning of Introduction to Anthropological Archaeology course.
As described in the introduction, the students' previous knowledge of archaeology proved to be based on mass media concepts and/or based on prior knowledge that interfered with their knowledge of professional practices; therefore, the first part of the lecture was designed to give a real sense of the profession of archaeologists, before teaching the basics of fieldwork methodologies (Figure 9). An ill-defined problem is a useful means to engage students in realistic professional questions and issues.
The ill-defined problem also proved to be a very effective instrument to acquire direct evidence of student learning. Students who practised the stratigraphic method using 3VD demonstrated strengthened abilities to complete the ill-defined problem, compared to their peers working with the traditional exercise (i.e. 2D profile).
Nonetheless, findings in relation to the research questions demonstrated that the intended learning outcomes were not equally strengthened (for the complete set of questions see Appendix 3):
Q1: 1. Please complete the sentence: Stratum A is younger than stratum B, according to the__________.
Q1 was aimed at testing students awareness of the specific terminology related to the stratigraphic method. The results showed that, unlike their 2D peers, most of the students working with the 3D application remembered the law of superimposition, X2 (1, N = 110) = 10.96, p < 0.001. This result might be explained by the fact that, as already discussed, in the 3D application a text systematically repeats the importance of this law every time students detect and excavate a unit (either successfully or unsuccessfully).
Q2: What is the relative temporal relationship of stratum O and stratum N?
Q2 was given to test students' ability to recognise the temporal relationship between two superimposed layers in a stratigraphic sequence. The test results show that this learning outcome was strengthened in the 3D group, X2 (1, N = 109) = 8.03, p < 0.01.
Q3. What is the relative temporal relationship of stratum G and K?
Q3, like Q2, was aimed at testing students' capacity to understand the chronological relationship of different layers. Specifically, this question was aimed at testing students' understanding of the relationship between a pit fill and a layer cut by the construction of the pit. Unfortunately, the results show a non-significant difference between the 2D and 3D groups, X2 (1, N = 110) = 3.07, p = 0.08. If we look at the correct and wrong answers, though, we can see that the results, even if similar, are reversed: in the 2D group, in fact, just 20 students were able to give the correct answer, and 32 people gave the wrong one; whereas in the 3D group 32 people gave the correct answer and 26 the wrong one. As a result, even if these findings clearly demonstrate the challenge students face when asked to recognise a pit fill, they show a quite important difference between the 2D and the 3D group, and seem to demonstrate that the application was more effective than the 2D exercise.
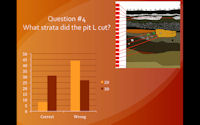
Q4. What strata did the pit L cut?
The goal of Q4, like the previous question, was to understand if students were able to define and explain the relationship of a pit with its contiguous layers. In contrast to the previous question, though, this time students were told that L was a pit (i.e. they did not have to recognise it) and were just asked to determine the cut layers.

Figure 10: This graph shows the results of the test for question 4: "What strata did the pit L cut?"
In this case the results demonstrate that the 3D group, who interacted with a 3D pit, was able to retain the information learned through 3D hands-on activities and use it in the test, X2 (1, N = 110) = 17.35, p <.0001 (Figure 10). The discrepancy between these results and the previous one might be used to value our application, since they might demonstrate that, students, when working with a traditional 2D profile, are less likely to recognise 3D features such as a pit and its fill.
Q5. The pit cut L is likely:
Similar results can be registered for Q5, in which students were asked to determine the chronological relationship of the pit and other layers of the proposed stratigraphic sequence, X2 (1, N = 110) = 9.13, p < 0.01. This datum reinforces the results of the previous question and shows how effective the application was in helping students recognise a 3D feature and its relationship with the stratigraphic context.
Q6. Artefact 1 is likely: Explain your answer:
Q6 was more challenging for students, since it required them to think about the chronological relationship between artefacts in a stratigraphic sequence. The challenge of this question was related to the fact that, while the lecture included a part dedicated to artefacts analysis in a stratigraphic sequence, this aspect was not stressed either in the 2D exercise or in the 3D application. As a result, there is a slight significant difference between the 2D and the 3D group, X2 (1, N = 107) = 3.51, p = 0.06.
Q7. Artefact 2 is likely: Explain your answer:
Q7, like Q6, was aimed at testing students' understanding of the relationship between artefacts in a stratigraphic sequence. The majority of students were not able to give a correct answer to Q7, X2 (1, N = 110) = 0.8, p = 0.37. Most of the students answered that artefact 2 was the same age as 3. This datum might have been determined by an inappropriate choice of the layers to be analysed. Looking at the 2D profile (Appendix 3), in fact, stratum J, where artefact 2 is deposited, is a small layer, which could have been confused with stratum I where artefact 3 is located, leading to the wrong answer.
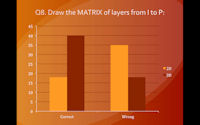
Q8. Draw the MATRIX of layers from I to P:

Figure 11: This graph shows the results of the test for question 8: Draw the MATRIX layers from I to P
Finally a significant difference between the 2D and 3D groups can be seen for Q8, in which students were requested to create the MATRIX of the given stratigraphic profile, X2 (1, N = 111) = 13.6, p < 0.001 (Figure 11). Since in the 3D application the matrix of the stratigraphic sequence was created step-by-step, while the students recognised and then removed the layers, 3D students apparently retained the information and strengthened this learning outcome more than their 2D peers.
In conclusion, the results of the test demonstrate that the 3D application helped students to retain information and apply it during the test. The application was focused on stratigraphic relationships between layers, and did not cover training with 3D artefacts. The artefacts reproduced in the application, in fact, were not considered single 3D objects (i.e. they were scanned as part of the layers), and the users could not interact with them. The latter point explains why students were less prepared to answer questions related to artefacts in their depositional context.
Direct evidence of students' learning comes also from the post-survey, from one open-ended question in particular: when asked to describe the archaeological dig again, the 3D group answers were, on average, more accurate and with an emphasis on the top-down process and stratigraphic method. This means that the 3D experience helped students to understand the physical relationship between space and time, that is, the foundation of the archaeological excavation process.
The post-survey was also helpful in assessing the 3D application. More than fifty per cent of the 3D group students liked the application, and considered it an effective instrument for understanding fieldwork and the archaeological method. In particular, some students highlighted the fact that 3VD was the closest experience to fieldwork that they would have acquired from the course. The survey also contained a question on how to improve the application: most students hoped to have an immersive experience, being able to virtually recognise and excavate the units, perhaps with the help of an avatar handling pick, shovel, trowel and buckets. Some students, in particular, registered the lack of realism in the stratigraphic sequence proposed, since the layers were already pre-determined and no information was provided on the amount of time required to recognise and excavate the units using different tools.
© Internet Archaeology/Author(s)
University of York legal statements | Terms and Conditions
| File last updated: Wed Dec 12 2012