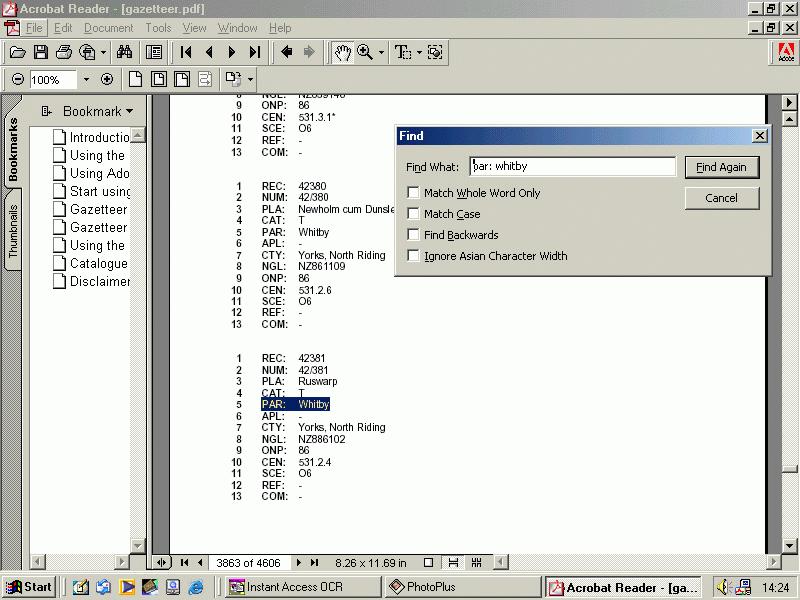
Figure 1: Data categories displayed in Acrobat Reader with search facility in use
Cite this as: Pickles, T. 2002 Review of Historic Parishes of England and Wales: An Electronic Map of Boundaries before 1850 with a Gazetteer and Metadata., Internet Archaeology 13. https://doi.org/10.11141/ia.13.7
A 9 CD-Rom package designed for use with Adobe Acrobat Reader and Adobe Illustrator (not supplied). For PC and Mac. Price: £45. Accompanying book Historic Parishes of England and Wales by Roger Kain and Richard Oliver also available. Price: £12.50. Available from: History Data Service. Email: [email protected]
According to the authors, Historic Parishes of England and Wales aims to provide one possible solution to 'a major lacuna militating against the effective exploitation of many post-medieval to mid-Victorian historical sources collected by local administrative areas.' That is 'the lack of information on the boundaries of those administrative areas: the so-called "historic" or "ancient" parishes of England and Wales.'
There is no doubt that this is indeed a problem, and that such information will find a wide potential audience. As they admirably illustrate in the accompanying book, parish boundaries have been some of the most enduring and stable organising units, certainly formed by the thirteenth century and largely unchanged until the nineteenth. However, a series of Victorian parliamentary acts sought to rationalise the parochial pattern, and no national sources exist that record the status quo preceding these changes. Kain and Oliver point to an impressive number of historians of locally compiled sources who would benefit from reliable information on these pre-Victorian boundaries, and their list is by no means exhaustive.
The core of the package is a database of 'metadata', intended for use with either Acrobat Reader or Microsoft Excel, which records the character of each administrative unit mapped, and the origins of the evidence for its boundaries. Three CDs contain this database in addition to maps of the 'historic' parish boundaries of England that can be read using Acrobat Reader, with the necessary reader software supplied. A further six CDs contain those same maps saved as three separate interactive layers, to be viewed using Adobe Illustrator but this software is not included.
Before beginning to explore the software, it is worth considering the role of the accompanying book. It is intended to introduce the CD-Roms, providing background about the techniques used in compiling the maps and the 'metadata', and containing an abbreviated hard copy of the 'metadata'. Kain and Oliver seem to have had three over-riding intentions for this book: to justify the project and identify its aims and audience; to lay out for the user their methodology in compiling the database and maps, and the system of abbreviations employed on the CD-Roms; and to provide an abridged hard copy of the 'metadata' included in the database. While the result is clearly laid out and concisely written, it does reveal some of the inherent problems with their product.
The value of the project has already been acknowledged, and the section of the book laying out their aims and justification is very good. Both have career experience writing about the history of mapping, and their historical précis of the development of parish boundaries themselves, and of the origins of Ordnance Survey (OS) mapping are accessible and useful. Similarly, their account of the compilation of the data and the maps lays bare the methodical thoroughness with which the work was approached. After laying out a master map of the parishes themselves, they worked from the 1851 Census to number each unit and identify those areas for which the census provided no information. Evidence for the remaining units and their boundaries was then sought from early OS maps, tithe maps and local estate maps. As historians they cannot be criticised, and the result is a methodically sound and invaluable work of reference.
Yet there are minor niggles with their account in the book. Terms are of prime importance in this kind of work precisely because there have been confusing regional and temporal variations in the naming of local administrative units. In chapter 2 they discuss the problems of the overlapping use of the terms 'township', 'tithing' and 'hamlet' to describe sub-divisions of the ecclesiastical parishes, sometimes later mapped by the OS as 'civil parishes'. During the discussion they note that these subdivisions were recorded as 'census parishes' in the 1851 Census, and elsewhere that the Census information formed the backbone of their project. By this indirect route it is revealed that the units represented on their maps are in fact those subdivisions rather than the older ecclesiastical parishes, but nowhere is this explicitly acknowledged. Of course, given that the status of each unit is recorded in the database, and that the 'mother parish' of each unit is also given, this fact becomes clear after a short period of use, and the ecclesiastical parishes can be reconstructed from the database.
Such potential for confusion might have been avoided by the inclusion of a short glossary of terms, which would also have provided an opportunity to define the technical terms 'centroid' and 'metadata', used liberally without explanation. To the uninitiated user, both terms might present a real challenge, although again the meaning of both becomes manifest with use. 'Metadata' describes how, when and by whom a particular set of data was collected, and has been employed here to refer to the database because it provides information on the compilation of the boundaries on the maps. 'Centroid' describes the National Grid Reference given in the database for the geographical centre of each region drawn on the maps, so that the maps can be converted for use in digital mapping programmes.
Putting these minor niggles aside, the real difficulty lies in the question of why it seemed necessary to publish an accompanying book at all. A small part of the information included in the book (the key to the abbreviations, without which the database could not be used) is included on the CD-Rom. Why not all of it, especially when the explanatory sections of the book comprise only thirty-nine pages in total? The remainder of the book is filled with an abridged version of the 'metadata' in gazetteer format. It is possible that this gazetteer was a nod towards those historians not yet comfortable with computing, but it probably also acknowledges the difficulties encountered when using maps and database simultaneously, which requires the user to swap between two different programs.
Apart from the abridged version in the book, the 'metadata' is supplied in two formats: Adobe Acrobat Reader (PDF) and Microsoft Excel (XLS). In both cases the data itself and the system of abbreviations are the same, so this will be considered before discussing the merits of the separate formats.
Kain and Oliver have broken the data down into fifteen sub-groups that can neatly be divided into two types of information. First there is locational and identificational information, including the name of the unit on the map and a unique identification number for that unit, followed by the type of unit represented, the 'historic county' (pre-1974) in which it is located, a national grid reference for the centre of the region, and the number of the OS sheet on which it appears on the CD-Rom. Secondly there is the historical data, including the 1851 Census parish number, the source from which the information on the boundary was derived, an archive reference for that source, and a field for comments on conflicting source references. The system itself is simple and self-explanatory once the abbreviations are mastered, and it is straightforward to locate a unit, identify its administrative status and then check the reliability of the historical evidence for it.
Figure 1: Data categories displayed in Acrobat Reader with search facility in use
Naturally though, this system is only as useful as the format in which it is provided. Appended to the book as an alphabetical gazetteer ordered by the name of each unit, it is as good as any static index. However, both the formats on the CD-Rom leave something to be desired. Adobe Acrobat Reader is provided on the CD-Roms, to ensure that even without Microsoft Excel the information can be accessed without further cost. Acrobat Reader presents the database as a single uneditable list ordered by each unit. In common with the other files on the CD-Roms it can be slow to run from the CD itself, but can easily be saved to the hard drive to speed things up. Although the information is not in tabular format, it is possible to search by category, for example using the 'find' option along with the term 'pla: whitby' to find a given unit, or 'par: whitby' to find a given parish. But the information cannot be reordered, and can only be printed page-by-page, not entry-by-entry, so that if hard copies are required the results will include a large number of extraneous entries. Like the abridged version it is useful for looking up a series of individual units and their boundaries, but little more.

Figure 2: Data queried in Microsoft Access to isolate all the townships in Whitby parish
Similar comments could be made about the Microsoft Excel version, but this format has one great advantage over Acrobat Reader: it is in tabular form and can be exported into Microsoft Access to be used as a database rather than a spreadsheet. In database format it is much easier to search and re-organize the information. It is slightly surprising that the data was not provided in this format, though it may have been thought that more people were conversant with spreadsheets in general, and Microsoft Excel in particular. Querying the data in Access allows all the parishes in a particular county, or all the townships in a particular parish, to be isolated and saved as a separate table. Any extraneous columns of information can then be eliminated, allowing users to tailor the data to their own specific needs and print the results to check up alongside the maps. Unlike Acrobat Reader, Microsoft Access is compatible with the majority of word processing and desktop publishing packages, so that the tables can be exported and re-used in presentations (with acknowledgement.)
Like the database, the maps have also been provided in two formats: Adobe Acrobat Reader (PDF) and Adobe Illustrator (AI). We have already seen that Acrobat Reader is included, but Illustrator must be purchased separately.
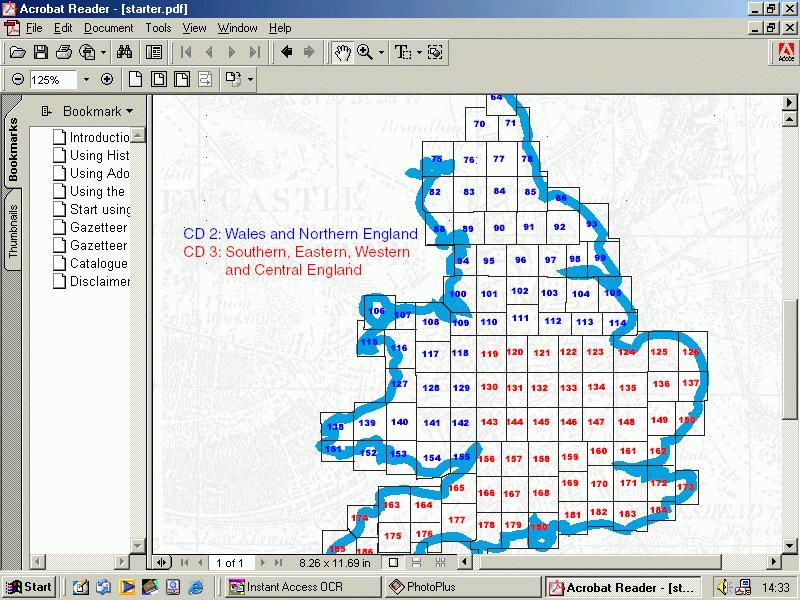
Figure 3: The index and key to the OS sheet numbers displayed in Acrobat Reader
The maps have been created and stored in three separate layers. First, there is a high-resolution scan of the first edition New Popular series maps published by the OS. Kain and Oliver explain in detail in the accompanying book why this edition was used, basically because they were the maps with the best combination of scale and projection that still recorded many of the earliest boundaries. The maps have been scanned sheet by sheet, and are therefore ordered by sheet number, with a key and master map of the sheets provided.
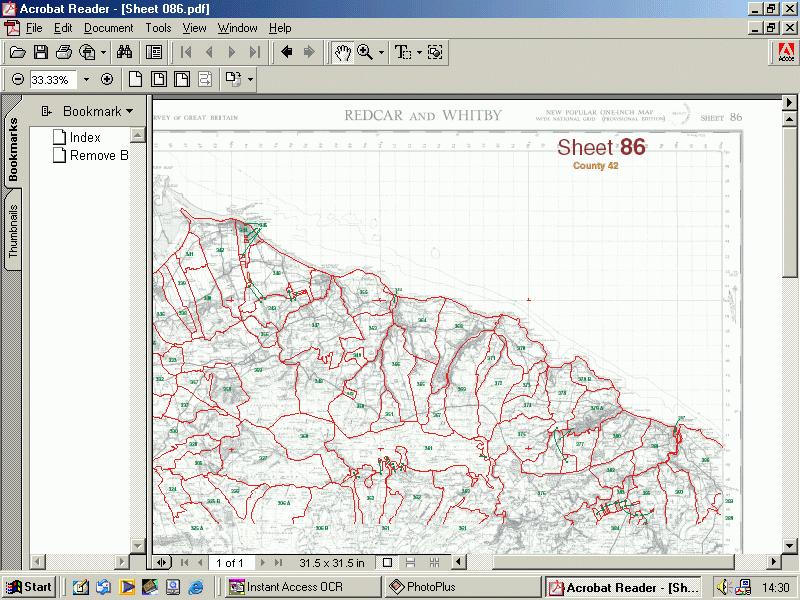
Figure 4: OS sheet 86 displayed in Acrobat Reader with red polylines tracing boundaries
A second layer consists of the boundaries themselves, saved as red polylines drawn over the grey base maps, with thicker yellow polylines tracing the route of the county boundaries. Polylines retain a thickness of one pixel regardless of the degree of magnification, which makes them ideal for this kind of project: complicated interlocking boundaries and minute extra parochial areas can still be mapped and remain clear to the eye at high magnifications. Particularly complex areas have been highlighted on the maps in purple and drawn separately for extra clarity. Finally, the third layer adds the individual identification numbers assigned by Kain and Oliver to each unit in order to link it to the data, along with a series of ties joining up the detached portions of any individual parish. Identification numbers and ties are saved as green figures and lines.
As a reference tool to locate and illustrate the units and boundary information recorded in the database the maps are adequate, but not ideal. The scanned layer makes the files large and unwieldy, at 30MB for an individual sheet. Saving them to the hard drive once again speeds up navigation, but for large areas this means saving a large number of files. It is noted on the CD-Rom that if maps are saved in their group folders then the navigational links for moving between different sheets will still work. For the purposes of locating a particular place, Acrobat Reader ought to be sufficient, but the inclusion of the base-layer scan sometimes makes it hard to view the green identification numbers except at high magnifications. Although the numbers are sequential from parish to parish, it can be difficult at such high magnifications to discern in which direction on the map the sequence runs. The green ties between parishes and extra parochial areas are similarly obscured. Furthermore, because the maps have been drawn and saved by OS sheet, many of the parishes break off abruptly at the edge of the sheet.

Figure 5: OS sheet 86 displayed in Adobe Illustrator with the base scan disabled
Some of the above problems can be overcome using Adobe Illustrator, which unlike Acrobat Reader allows editing and drawing, including the separation of layers. Once the base layer is turned off, the identification numbers and ties are clearer. If necessary the base layer can then be switched on once more to add the physical, cultural and place-name information. In practice though, the quality of the scan makes the base map grainy and the detail difficult to decipher. Place-names are often unreadable, and the map is over-crowded with information. Most users will probably find it easier to look up the area on a separate OS map.
An additional advantage of Illustrator is that the boundaries can be edited according to individual requirements. Using the layer tool the polylines on the boundary layer can be made editable, selected and moved using any of the nodal points created during the original drawing process. It would have been useful if Kain and Oliver had provided the county boundaries as a separate layer, and indeed the ecclesiastical parishes as a further layer, rather than just the smallest subdivisions. But it is possible with extra effort to produce a query in Access to locate all the townships in a given parish, and then draw over the common outer boundary of the ecclesiastical parish as a new layer in Illustrator. Furthermore, if any mistakes in the course of a particular boundary are noted during research, these can be corrected.
If Illustrator does offer a greater degree of flexibility than Acrobat Reader, there is one important drawback: the data is not geo-referenced, which means it cannot be used directly with a digital GIS mapping programme alongside other grid-referenced information. These kinds of programmes would allow data derived from sources organised parish-by-parish (like those highlighted by Kain and Oliver in the book), to be analysed and presented in far more sophisticated ways. Census data, for example, could be listed by parish, and compared with the topography of each region to produce themed and colour coded maps. It is however, possible to geo-reference these maps. From Illustrator they can be exported into AutoCad. Kain and Oliver have provided the 'centroid' for each unit, the grid reference for its central point. Although the maps are drawn as polylines, rather than as polygons (or regions) which would have been more useful, AutoCad can produce polygons for each unit from these polylines so that the grid references can be assigned.
At present this process may prove important for those who want to create maps based on township boundaries of this date in programmes like MapInfo, because the relevant dataset is not otherwise available. EDINA Digimap, the national digital mapping project at Edinburgh which provides free data for academics and research students, is working on these boundaries as a dataset to be released in the future, but in the meantime this method will suffice. Alternatively, for those interested in using the earliest parish boundaries, Digimap does provide the 1871 ecclesiastical parishes as a dataset. By this date many of the parishes had been subdivided, but in MapInfo this dataset can be modified using the database reviewed here as a source from which to combine each of the sub-divided parishes into a single unit.
Historic Parishes of England and Wales is beset by the tension created by the desire to provide a cheap and accessible research tool while harnessing the increased power and flexibility of computerised mapping and databasing. For £45 the user is provided with all the data alongside some basic software in which to view it, but that software offers no great advantages over paper maps and printed data. To take advantage of the digital format, users are recommended to import the database into Microsoft Access and to view the maps using Adobe Illustrator. Once imported into Access, the database cannot be faulted. The systems of abbreviation are clear and the information can be tailored according to individual requirements: the result is an excellent and much needed research tool. Equally, viewing the maps in Adobe Illustrator solves some of the more irritating aspects associated with them, and provides adequate illustration for the database.
Yet the problem remains that to view both maps and database simultaneously the user must swap between two different programs. Buying the accompanying book provides the user with an abridged hard copy of the 'metadata' in gazetteer format, and this can be used to look up places while viewing the maps without referring to the database. However, it is an extra £12.50 and only contains information already included in the database. These problems could have been avoided by transferring the maps to a GIS program, which would have afforded several further advantages.
Using a program like MapInfo which stores data in a tabular format, information from the database could have been included in tables directly linked to the polygons on the maps, to be viewed in a browser window alongside them. Furthermore, the scanned layer could have been discarded enabling a base map to be designed specifically for their purpose from digital OS data, perhaps including the place-names referred to in the database and the features which the boundaries follow. In turn, this would have eliminated the need to organise the maps by OS sheet number so that they could have been split into more logical units, perhaps by pre-1974 county. Finally, because the data would have been geo-referenced, it could have been combined with other datasets derived from historical sources to create new maps.
It is likely though, that designing and publishing this kind of package would have increased the price, and Kain and Oliver have provided their product in a format which allows those who wish to use the data in GIS programs to convert it themselves, whilst not pricing out of the market those who do not.
Thomas Pickles
Wadham College
Oxford
OX1 3PN
Email: [email protected]
![]()
![]()
© Internet Archaeology URL: http://intarch.ac.uk/journal/issue13/reviews/pickles.html
Last updated: Tues 19 Nov 2002