Figure 6 presents an example of graphical output resulting from the diachronic analysis, referred to as diachronic land-use maps. It indicates the degree of potential land use associated with all areas, i.e. the rate of area use over the set time period, presented in a range of colours translated as intensity of use (red = much used, yellow = rarely used; see key; see also Van Hove 2003, 203). Using this as a basis, it is argued that economic behaviour generates utilised (spatial and temporal) landscapes, from which concepts of movement, familiarity (Fig. 7) and subsequent societal importance, and socio-cultural perception can be hypothetically derived. Furthermore, resources potential, distance of travel and recommended site spacing can be discussed (cf. Van Hove 2003, 189).
a b
b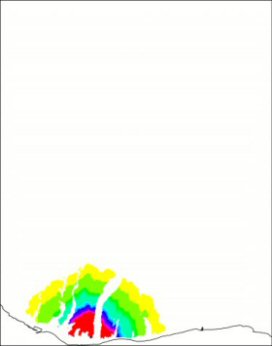
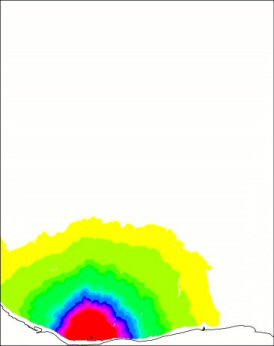
Figure 6: Farmland (a), herding space (b), and foraging territory (c), for Melitò di Porto Salvo, using an economy with 62.9% farming, 23% herding and 14.1% foraging (optimal farming model; Gregg 1988, 178) through one generation (30 years), for 50 people
The models display a circular and diverging pattern of colours around a chosen site location. On a broader level, these areas of different colour reflect distinct zones created by accumulated human action, and are therefore believed to be potentially linked to different perceptions of space and changing spheres of influence on land use. The diachronic land-use maps show an increasing use of land close to the site and a decreasing one further away. Through time, settlements thus become associated with concentric bands of different human presence, ranging from very intense, daily use, to occasional utilisation through intermittent years. The same pattern of spread is applicable to farming, herding and foraging land use.
This pattern of coloured bands is related to the assumption that was made as part of the generic land-use analysis. Each simulation was set up to start accumulating land from the site outwards. People choose the most suitable (high yield value) but also the closest territory (based on cost-surface analysis) available to suit their land needs. Logically speaking, this incrementing pattern of use around the site can be considered the result of a sequential exploration of environments, reflecting the improbability of people neglecting closer areas to access more distant areas first, within previously unexplored territory. This may seem like a straightforward and built-in pattern (which it is), but it could be related to so much more than basic land use. Different land-use signatures, as related to different economic decisions, enable extending interpretations beyond purely physical presence and allow the conceptualisation of rhythms of human activities, of moving into different zones. This supports the idea of exploration incorporating knowledge and experience, reflects activity histories and indicates the potential reading of a humanised landscape. Overall, it permits a qualitative assessment of a quantitative landscape and the linkage of landscape histories with their material counterparts, rather than just the presentation of an abstract two-dimensional Cartesian viewpoint. Last, but not least, what such GIS models produce are human-scale frequentation maps, short-term landscapes of use, of which variations in the spatial patterning of experience on environmental and socio-cultural levels can be envisioned. Such GIS analyses form a basis from which spheres of understanding can be imagined, taskscapes.
These spheres of understanding are generated against a backdrop that can take on particular forms, because a variance in economic strategy implementation results in different use signatures and use intensities over time (cf. Fig. 6). Red areas on the diachronic land-use maps represent high degrees of potential land use or spaces of intense use. Because these zones are located within reasonably short distances from the site, one could imagine they were visited daily for routine activities with regard to farming. Distance might have been perceived as a negative aspect, understandable in view of the bulkiness and weight of harvests carried back from the field. Hence, these areas would have figured as constant features in human behaviour, more specifically related to food production. This could even have impacted on the ritual cycle (cf. Bradley 2000, 10, 79). Overall, due to their nature, red areas could have formed a basis for the appreciation of particular experiences, specific understandings and distinct taskscapes, related to daily routines. They would have acquired a particular significance in the minds of people and could thus have influenced the understanding of the land as a whole (Bradley 2000, 36).
Yellow areas reflect low degrees of potential land use and could be identified as areas which functioned as occasional stop gaps in the generic journey revolving around land use. Visited only on an occasional basis, for example on a particular hunting trip or raw material search, for a specific ritual or as part of gender related, (and possibly) secluded activities, such areas could potentially have become associated with experiences and understandings very different from red areas. However, they could still have played a vital role in the way people perceived their surroundings and therefore acted within them. For these areas and their functions, distance was not necessarily viewed as a negative aspect. Rather, it could have been necessary to increase distance to achieve or enhance the effect of separation, which could have been important socially, culturally and symbolically. Distance could have associated areas with an exotic value. Regions that are far away and areas that are rarely seen can be perceived as special and information or material from such zones can be valuable, regarded as 'pieces of places' (cf. Bradley 2000, 81-84). Within yellow zones, different taskscapes, related to less usual practices, would have been created.
Green areas symbolise the 'areas in between'. They were probably not exotic or mundane but took on different guises according to their time of use. Their key feature could have been movement. This could have included seasonal camps, which – to a certain extent – enabled controlled people movements and could have guided exploratory behaviour for a fixed time period. If animal movement remained strongly monitored by humans, seasonal camps might have been moved in line with the herd's behaviour. Similarly, green areas could have been the stage for well-oriented foraging trips (regular exploration of the same zone), specifically geared towards maximising gain from smaller movements. A river environment could have become a constantly renewing resource if monitored closely, and trips to find certain resources might have involved checking out regular foraging patches. A similar attitude might have been taken with regard to raw material searches. A network of such spots could have been organised to maximise the gathering of information through limited time-periods. This could explain the lower site-linked use (green area).
Thus, one is faced with a land-use map, in which different layers of human experience, perception and understanding and different taskscapes related to farming, herding and foraging can be played out (Fig. 6). Highly visited areas (red) could have formed an important part of the social structure of a group, because of the detailed knowledge that was built up through them. They could have been essential to a group's support network and could have become surroundings that were so intimately known that they would have been regarded as key to society, on different levels of perception and survival (material and symbolic). For example, farming zones could have induced a feeling of stability and long-term planning. Areas that were only visited on an occasional basis could have received their importance from the way they allowed groups to exceed their normative behaviour. They could have functioned as the outlet for certain types of behaviour only possible outside the better known areas (e.g. trading, fighting, burial, ritual seclusion; cf. Robb and Van Hove 2003, 251-52). Such domains could have conveyed prestige and/or notions of unique experience. Areas visited at different frequencies and in different ways could thus have been perceived as important on distinct physical and historical levels (see Fig. 7). This is because different space use generates a network of perceptions and associated taskscapes, with often-blurred boundaries (2.1 and 2.2) (cf. Van Hove 2003, 220-21). These taskscapes are not present within the simulation results themselves, but asserted from them, as shown in the following example.
© Internet Archaeology
URL: http://intarch.ac.uk/journal/issue16/5/3.6.html
Last updated: Thur Nov 11 2004