
Figure 2: Plan of Utrecht in 1846, based on the map of Van der Monde (North at top)
In order to be able to discuss the development of urban space successfully, it is advantageous to have complete town plans for the period under review. Moreover, the space syntax techniques work best when applied to complete town plans, as incomplete town plans could lead to calculations being focused on the wrong spaces. This requirement immediately highlights one of the problems with the study of urban development and the use of space syntax in particular, since it is very rare to have accurate plans of historic towns. However, this is a problem the town plan analysis techniques of Conzen and Lilley (2000), Lilley et al. (2005) and Conzen (1968) help to solve to a degree. Their morphological analysis is based upon the premise that British Ordnance Survey maps published between 1843 and 1893 on a scale of 1:2500 or 1:5000 can be used as a basis for the derivation of medieval town plans (Lilley 2000, 11). For the Netherlands similar evidence is available as the first uniform and plot-patterned cartography was organised in the first half of the 19th century, drawn on a scale of 1:1250 (Margry et al. 1987). For Utrecht, the plan created by Nicolaas van der Monde (1846) will be used, which was the first accurately surveyed plan of Utrecht (Donkersloot-de Vrij 1983; 1990). The reason for not using more recent plans is because many Dutch towns changed substantially at the end of the 19th and during the 20th century, making town plan analysis much more difficult if not impossible. In Utrecht, this far-reaching change can mainly be seen in the creation of Hoog Catharijne (shopping centre), the destruction of the western canal and the development of the north-western part of the town centre.
This first cadastral plan needed to be turned into a vector [1] drawing using a computer programme (such as Adobe Illustrator or AutoCAD, - both produce drawings which are comparable in use and quality). This vector drawing only showed the plot patterns, streets, waterways and town walls, thus erasing any other features the original map might show which could obscure the important developments. The drawing formed the base town plan from which to start the morphological analysis.
Figure 2: Plan of Utrecht in 1846, based on the map of Van der Monde (North at top)
On this base town plan for Utrecht, I plotted the various forms of evidence, such as archaeological excavations, archival evidence, secondary sources, antiquarian histories and standing buildings, in order to gain an insight into how the street-grid of the town changed over the centuries (for more details on this technique, see Lilley (2000). For the later middle ages it was even possible to make use of antiquarian maps. Even though these are usually not cartographically accurate, some faults can be corrected by transposing the antiquarian town plans upon the accurate base town plan, for instance when a uniform but wrong scale has been used, or by comparing each insula separately with its 19th-century successor where the scale varies within the map (e.g. for symbolic reasons). Among the antiquarian maps available for Utrecht were those by Anthonie van den Wijngaerde (1558), Jacob van Deventer (1569-1570), Frans Hogenberg (1572), Joan Blaeu (1649) and the map created by the students of the Fundatie van Renswoude (1778).
From this evidential collection more maps were created which showed the street-grid at earlier stages in the town's history. At this stage it was also important to record any evidence relating to the (navigable) waterways since many of them changed course (natural and man-made processes), and many were used as a means of transport. The town of Utrecht, as will become evident later, is a prime example of how much a waterway can influence a town spatially and geographically. Even though these waterways could not yet be incorporated into the spatial analysis, special note was taken of them in order to be able to analyse their centrality and importance. Moreover, due to the economic focus of this study. particular attention was paid to market spaces, shops and related buildings and features.
As is evident from this, the technique of town plan analysis is very time-consuming. This technique has therefore previosuly been applied to villages or small towns (Conzen 1968; Lilley 2000; Lilley et al. 2005). Since the actual evidence-gathering in this research is secondary to the methodology, the case study of Utrecht was chosen for its wealth in readily available primary and secondary research, which could directly be used in the proposed methodology.
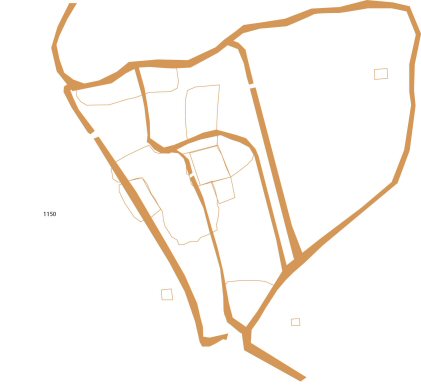
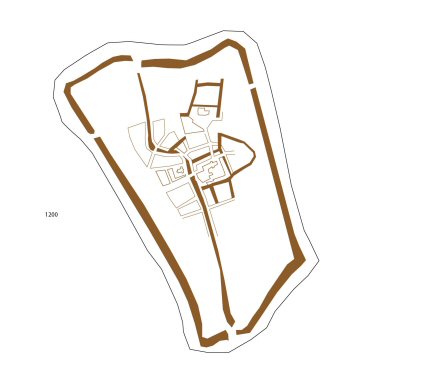
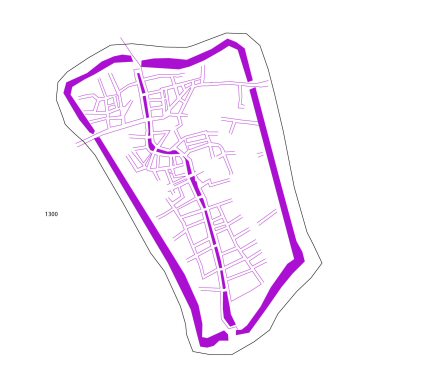
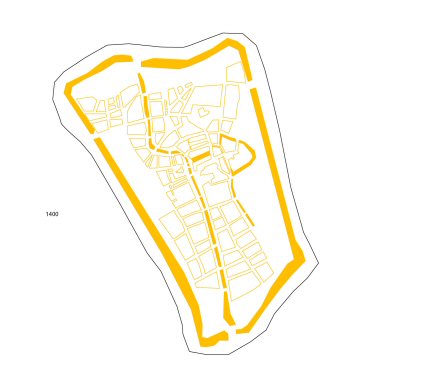
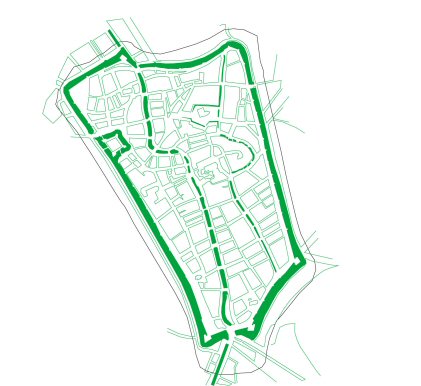
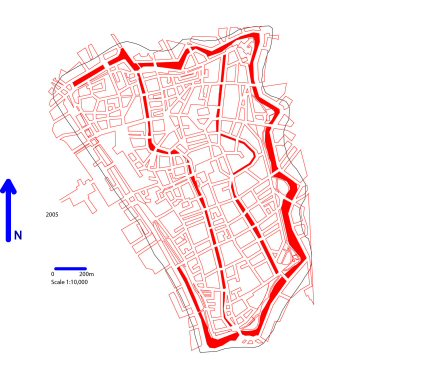
So working backwards from the most modern representation, and after analysis of the archaeological and historical evidence representing Utrecht at various stages of its development during the medieval and successive periods, a series of maps was created. Town plan analysis enables one to create several plans of a town during various stages in its history. However, the number of maps and their exact dates will depend upon the evidence available. For the town of Utrecht the plans of 2005, 1846, 1550, 1400, 1300, 1200, 1150, and 1000 were created. However, only the most recent maps were complete. All of those vector drawings, for which some evidence of the street grid was obtained, were then carried into the next stage of the methodology, involving analysis of integration patterns by using spatial analysis.
Figure 3: AD 1000 | Figure 4: AD 1150 | Figure 5: AD 1200 | Figure 6: AD 1300 | Figure 7: AD 1400 | Figure 8: AD 1550 | Figure 9: AD 1846 | Figure 10: AD 2005 |
'Select a link to view images of the development of Utrecht (North at top)'
![]()
© Internet Archaeology / Author
URL: http://intarch.ac.uk/journal/issue21/5/2.html
Last updated: Wed Aug 8 2007