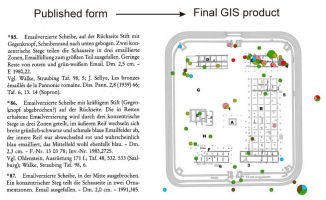
Figure 1: Sample of published artefact catalogue of brooches (Zanier 1992, 177) and final GIS plot for dress-related artefacts, plotted according to gender, from Ellingen.
This article outlines the methodology employed for the 'Engendering Roman Spaces' project, described in Allison in this volume. It highlights the processes by which 'legacy data' were transformed to address the research questions of this project. It also discusses some of the problems encountered in using these data, and the resolutions of such problems.
This project used GIS techniques to carry out small-scale inter- and intra-site analyses of artefact distribution within built environments. Moreover, it used GIS as an analytical tool to assess the data compiled in printed excavation reports. The difficulties with this approach were in the implementation of appropriate methodologies for importing and adapting existing printed data, and then with the creation of clear and cohesive displays for the analysis and interpretation of these data, so that the project's specific research questions could be addressed. These questions had not been taken into account when the excavations were originally recorded and published.
Figure 1: Sample of published artefact catalogue of brooches (Zanier 1992, 177) and final GIS plot for dress-related artefacts, plotted according to gender, from Ellingen.
How did we get the data from the printed form to the final form in ArcGIS (Figure 1)? The methodologies employed in this project involved the selection of suitable published sites, converting their printed plans and artefact catalogues into digital formats so that the artefacts could be sorted according to provenances and activities, and then mapping these artefacts, according to interpretative categories, onto the new digital site plans using GIS techniques (Figure 2).
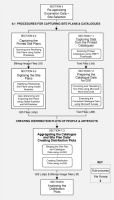
Figure 2: Methodology and software workflow (drawing by A. Fairbairn and C. Blackall)
As outlined by Allison in this volume, the sites were selected if their published excavation reports had the relevant characteristics for analysis. Each site had to have a relatively comprehensive artefact catalogue and usable site plans. Each catalogue entry needed to have an associated find-spot or provenance within the site, to locate each artefact or group of artefacts on a digital plan. Even within these criteria, each of the sites investigated - Vetera I, Ellingen, Oberstimm, Hesselbach and Rottweil Forts I-II - varied considerably in terms of the detail within each catalogue entry, the information in the site plans and, more importantly, the provenance information provided. The following discussion examines the procedures used in each of these sites, in the order that they were processed.
The primary source data for this project were the printed artefact catalogues and site plans, the formats of which vary between the sites chosen. The first stage was to 'capture' these data and convert them into formats that could be used in a GIS environment, so that their distribution and density could be plotted.
© Internet Archaeology/Author(s)
URL: http://intarch.ac.uk/journal/issue24/6/1.html
Last updated: Mon Jun 30 2008