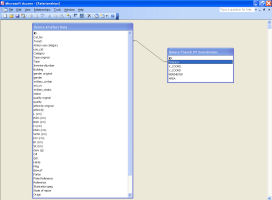
The artefact data tables organised data by catalogue entry and the provenance data tables organised data by numeric location identifier, or provenance code. ArcGIS, with its limited database capacity, is unable to generate the quantitative summaries of these data (i.e. the number of each artefact category from each provenance) needed to plot their distribution and density. The next step was, therefore, to import the artefact and provenance data tables into a relational database programme which could generate outputs using its query function, to produce summary quantitative data that could be used in GIS. Because of its widespread availability, Microsoft Access was used. The artefact and provenance data tables were linked within the Access database by creating a relationship based on the provenance code fields as the unique identifier in both tables that enables the artefact data to be queried relative to their locations. For example, at Vetera I, the link was created on the trench and feature numbers in the artefact catalogue and provenance data tables (Figure 4).
Figure 4: Example of relationships between tables in Access, linked by provenance codes in the 'trench' field for Vetera 1.
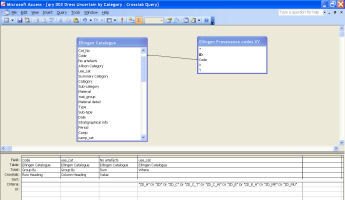
Figure 5: Example of the cross-tab query procedure for possible dress items at Ellingen, with linking provenance codes in the 'code' field.
To generate a quantitative summary of the number of artefacts of each category (e.g. female, male, child, etc.) within a given interpretative type (e.g. gender) found in each provenance within the site, Access cross-tab queries were used (Figure 5). The cross-tab query process involved:
selecting as the first column heading the field with the provenance codes;
selecting for further column headings all the SQL abbreviations within the field to be summarised in the query, such as activity or gender (e.g. all those that are categorised as possibly dress-related artefacts);
selecting the 'number of artefacts' field for each category within the specified interpretative type, which is automatically summed by provenance; and also
setting other parameters, by adding in further columns or limiting them, to refine the query further, e.g. selecting a chronological field to indicate in which specific building phases or periods particular activity or gender categories occur, or limiting the gender categories to only female- and child-related artefacts.
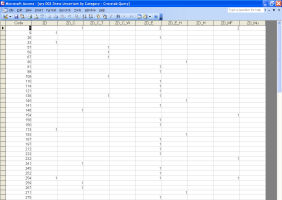
Figure 6: Example of the cross-tab query output for possible dress items at Ellingen.
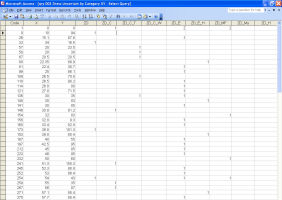
Figure 7: Example of access selection queries output for possible dress items at Ellingen.
The resulting output, the quantitative summary, indicated the number of artefacts of each category within a selected interpretative type at each location (Figure 6).
For these data to be plotted using GIS, the XY coordinates assigned to each artefact are also needed. For this, select queries were created that linked the provenance data table to this quantitative summary of artefacts. The provenance codes, or unique identifiers, and the X and Y coordinates in the provenance data table were selected and linked to the relevant provenance codes in the artefact quantitative summary, and thereby to the field categories (or column headings) that we wanted to export for mapping in ArcGIS. This output basically replicated the summary quantitative data produced by the cross-tab query between the artefact data and the provenance data (see Figure 6), but also included the XY coordinates for each location (Figure 7).