Figure 96: Sample chart: artefact date analysis
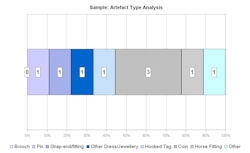
Figure 97: Sample chart: artefact type analysis
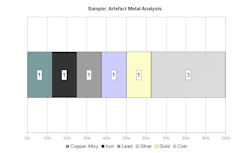
Figure 98: Sample chart: artefact metal analysis
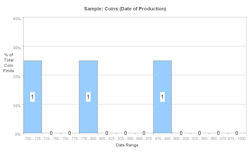
Figure 99: Sample chart: coins – date of production
Dating chart
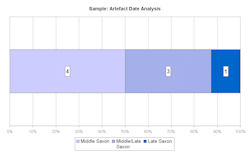
Figure 96: Sample chart: artefact date analysis
Figure 97: Sample chart: artefact type analysis
Figure 98: Sample chart: artefact metal analysis
Figure 99: Sample chart: coins – date of production
This section introduces the various analyses undertaken on the final VASLE 'Sites dataset'.
The VASLE dating charts use the format illustrated in Figure 96. The bar runs from 0-100%, with the size of the section for each period representing the proportion of finds from the site of that date. The middle section is filled with the colours of both the other two to provide a visual representation of the impact on the dating of the site of the artefacts that could only be dated as Middle/Late Saxon (see Section 4.2.1.1). The numbers in the centre of each section represent the actual number of artefacts of that date from the individual type, allowing a sense of sample size and how far relative comparisons between sites might be valid.
Artefact type chart
The VASLE artefact type charts use the format illustrated in Figure 97. The bar again runs from 0-100%, with the individual sections this time representing one of a group of artefact types chosen to cover most Middle and Late Saxon metalwork. The group was primarily chosen to reflect the assemblages recovered by metal-detector users, and the variety of artefacts encountered on excavated sites was therefore not always well represented; 'other' was intended to be the smallest category, and is for all but a few of those sites sourced from excavation reports. The colour choice of shades of blue for the first four artefact types indicates their similar function as dress accessories, and hooked tags are in a related shade (turquoise) to emphasise that many of them were probably also used as dress fasteners.
Metal type chart
The VASLE metal type charts use the format illustrated in Figure 98. The format is almost identical to the artefact type chart; here the colour choices were designed to be as intuitive as possible for the metal they represent. This chart type commonly has multiple categories with '0' values (lead alloys and gold, for example, are relatively rare); where two or more of these are adjacent, only one '0' value is visible on the chart as they overlay each other. Coins were listed as a separate 'metal type' to allow easy comparison of silver artefacts and to avoid distortion of the number of copper alloy artefacts on sites where there were many 9th-century Northumbrian stycas.
Coin chart
The coin chart format, as seen in Figure 99, is significantly different from the other three. It presents the detailed dating information that can be gathered from coin records in a standard histogram format. The scale is, again, relative to facilitate comparison of charts between sites, with the numbers in the bars indicating the actual number of finds from each site. The assignment of single date values to each coin-record is described in Section 4.2.2.1. It should be noted that the method of data-entry may have resulted in a distortion of the coin-dating charts for sites where the source dated coins only as Middle or Late Saxon. The problem arose because all artefacts were assigned a specific start and end-date to facilitate the dating analysis, so if a source used only Middle or Late Saxon dating, arbitrary dates (753 and 953 respectively) were assigned to the record during processing (see Section 4.2.4.1). Hence if a site had a large number of 'Middle Saxon' coins, the coin-dating chart would show a large spike in the 750-75 range, although that is certainly not an accurate representation of the Middle Saxon assemblage. In most cases this will have had only a minor impact, as most coins were dated much more closely, but, as discussed below, in the case of the site at Caistor in Norfolk, it probably led to a misleading representation of the assemblage.
© Internet Archaeology/Author(s)
URL: http://intarch.ac.uk/journal/issue25/2/4.3.1.html
Last updated: Tues Apr 21 2009