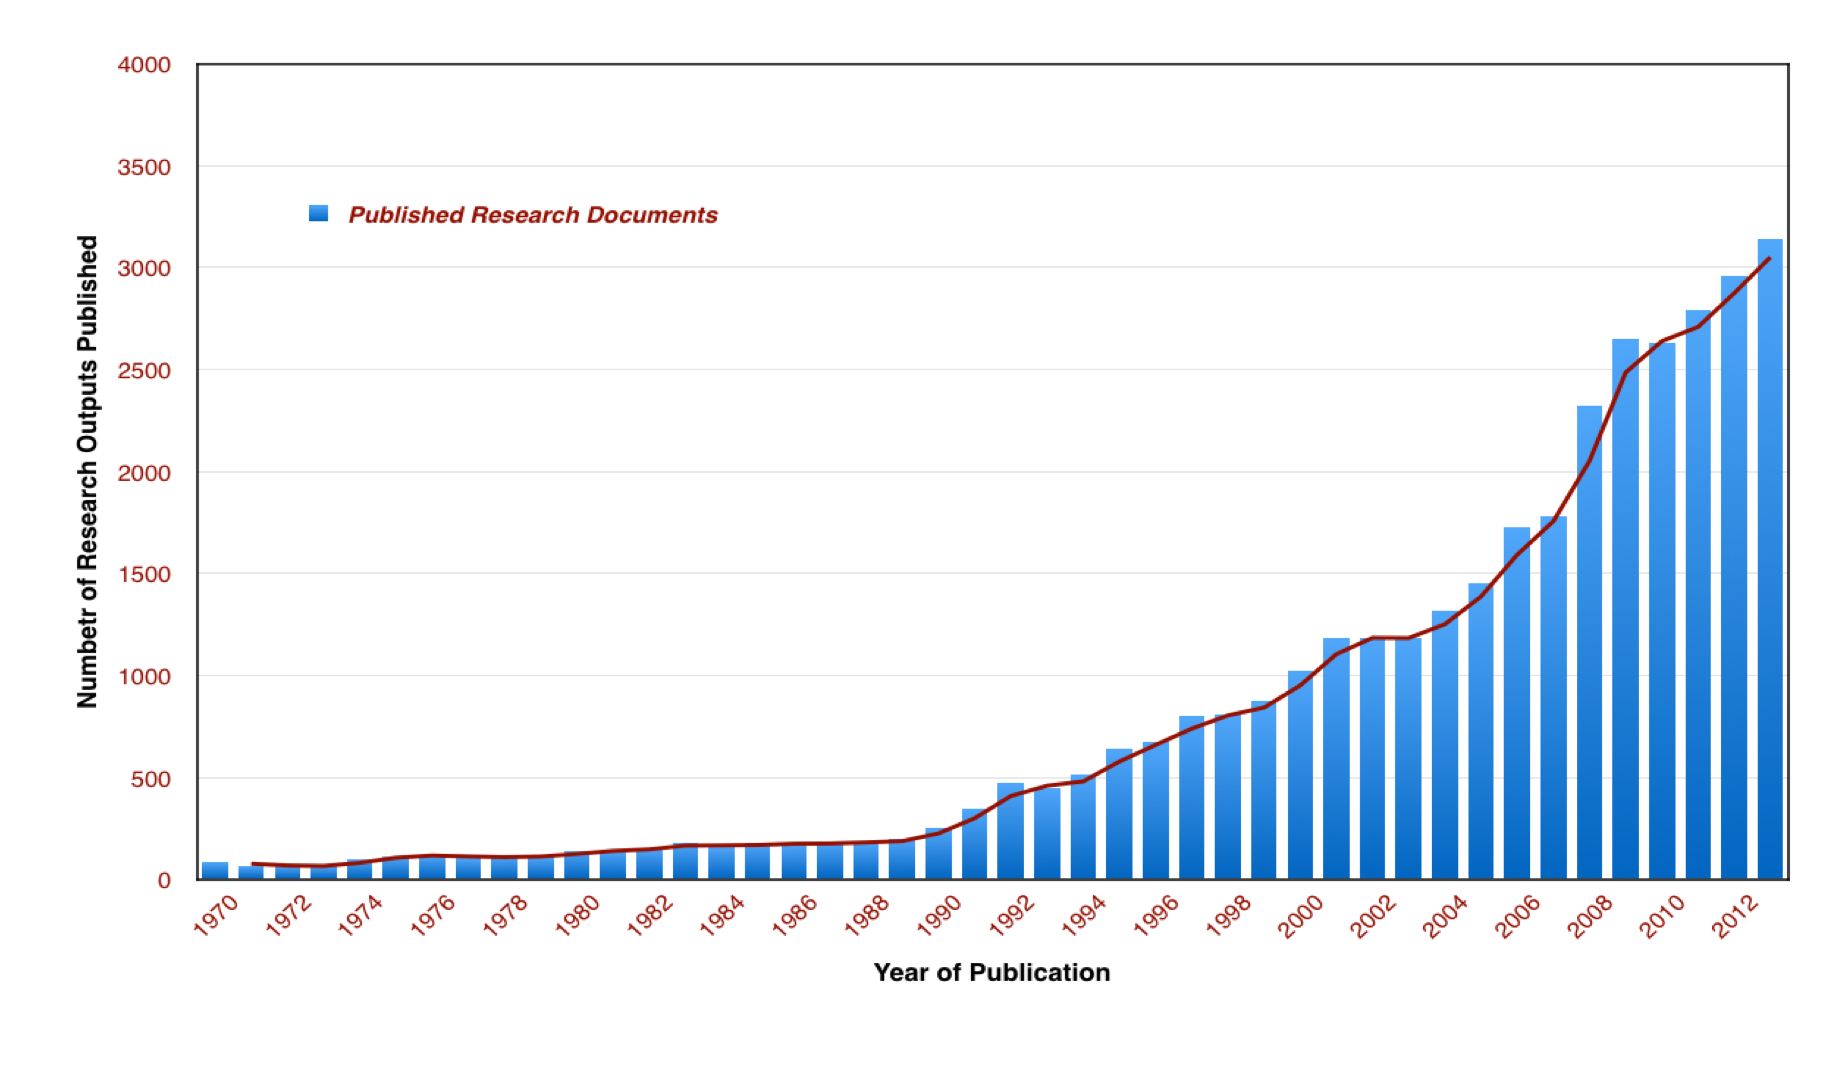
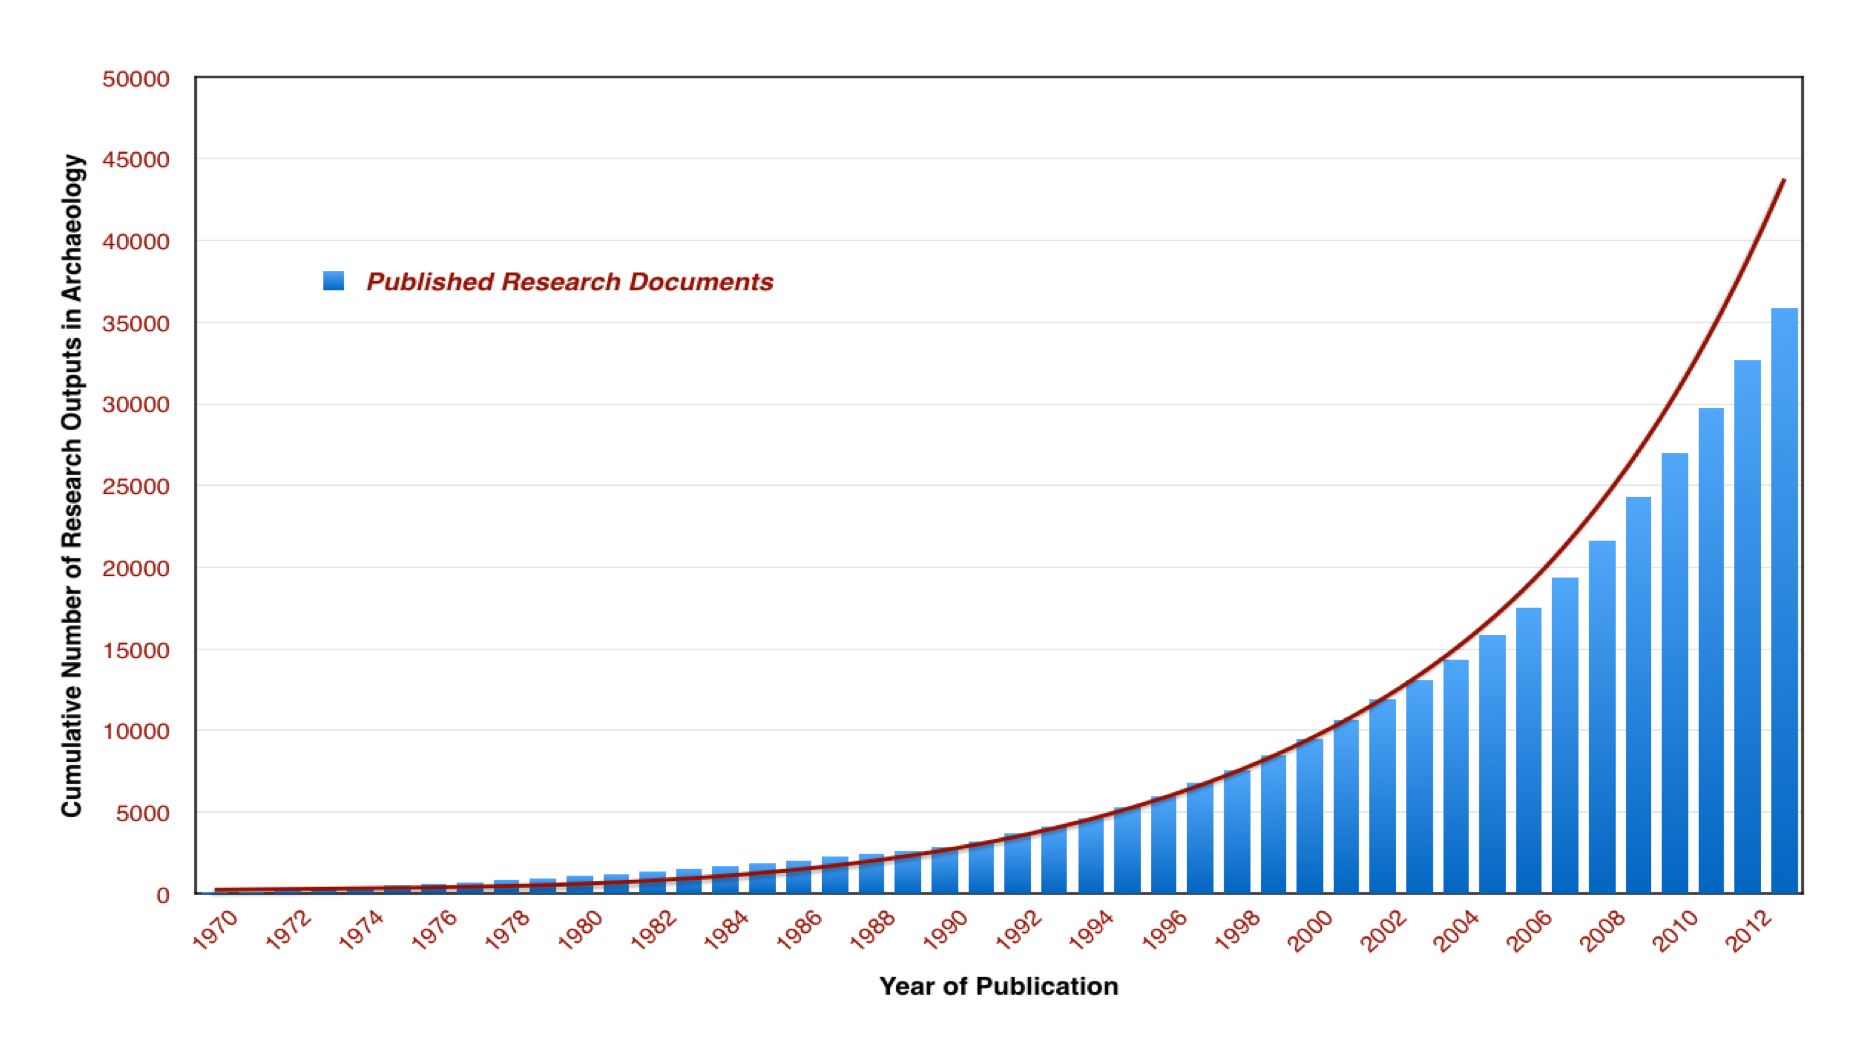
Data on the number of archaeological research outputs published each year can be collected using the Web of Science online search engine. For this study I have collected information on the number of outputs by undertaking a 'topic' search for documents containing the phrase 'archaeol*' in the titles, abstracts, Web of Science-defined keywords and author-defined keywords in the Web of Science Core Collection for a forty-year period from 1970 to 2014. As noted in the main text, a topic search for the phrase 'archaeol*' is an effective mechanism for identifying archaeological outputs, which can be refined by excluding documents defined as book reviews, conference abstracts, editorial material and so forth. From this search it is possible to identify more than 38,000 individual research outputs for the period. The actual number of research outputs in archaeology for each year of publication shows a dramatic growth following 1990 (Figure a), that when plotted as a cumulative total shows a pattern of exponential growth from 1970 until approximately 2006/7 (Figure b) leading to the total number of research outputs published in archaeology doubling every seven years. If a new student, starting archaeology today, determined to read and digest four new archaeological research outputs every day of the year from this corpus of 38,000 documents, it would require approximately 24 years and 3 months to read the archaeological literature published between 1970 and 2014. If the current rate of increase of publication continues, however, during this same time period, another 280,000 published research documents are likely to have been published and await reading once this student had finished this first set! On the basis of these numbers, it is easy to see that it is now impossible for any individual to read and digest this corpus of documents.
More than 60 years ago Derek de Solla Price (1951), an original advocate for scientometrics, demonstrated that the published outputs from scientific research were increasing exponentially in number. Price gave a catchy name to this observation; he called it the transition from 'Little Science to Big Science' (Price 1963). A quick analysis of the rate of publication of research documents in archaeology shows that it too follows an exponential growth pattern (See Box 1) and can now also be said to be an example of Big Science in Price's terms. While, in a simple sense, Big Science equates to the production of much more knowledge, the rate and scale of this transformation towards Big Science has made it progressively more difficult for individuals to keep on top of what is communicated through publication even within their own field. Price identified the creation of specialist abstracts journals in the 1840s and the development of citation indices by the Institution of Scientific Information in the early 1960s (Price 1963) as the scientific community's response to the problems of accessing new knowledge in Big Science. Indeed, online citation indices have possibly become such an effective solution that, as an unintended consequence, an individual researcher can both access relevant research outputs quickly and at the same time face the expectation that they should now be aware of all the relevant publications in a chain of conceptual thinking (Bawden and Robinson 2009; Weinberger 2012).
Besides the problem of finding relevant new outputs related to one's research, the proliferation of publications in the era of Big Science creates problems for any individual specialist to get an effective overview of the shape and connections of their own discipline and not just their research problem. In contemporary research practices a disciplinary overview has become ever more essential for recognising potential interdisciplinary synergies between research, and for determining where to invest limited research time and funds; a disciplinary overview makes it possible to see how disciplines and problems are connected and how these connections develop through time. An expert disciplinary overview is also increasingly vital to the evaluation of departments, research labs, or even individual researchers within contemporary research assessment or evaluation exercises where judgements of relevance, originality and potential impact of particular outputs to a discipline are important.
When the citation indices for science were first proposed by Eugene Garfield in the 1950s, he imagined an index of articles and their history of citation in later writings working in a similar manner to how contemporary legal citation indices recorded case histories and the use of certain cases as precedents in later cases (Garfield 1955, 468). The indices would provide a way of exploring how an idea developed and had influence, as recorded by citation, while the number and place of citations might work as a measure of the impact of an article. By recording information on author, date, title, source, type of publication (research article, review, book review, etc.), Garfield later realised that the chain of links between connected publications and authors facilitated a form of historical understanding of the development of certain scientific ideas such as genetics (Garfield et al. 1964). In this same vein, and inspired by the possibilities of the information that might become available through the citation indices of the Institute, Price (1965) described how the links made by citations from one document to another create a network of relationships between individual documents or publication sources, their topics of study, their authors and their disciplinary language that enables one to describe the nature of research fronts in science and how they come to life and lose their impetus through time. At a larger scale still, these same citation links can generate a picture of a discipline that gains its structure from the ground (the individual research output) upwards. Since 2003, it has become possible for even the largest sets of citation data to be collected and analysed, and for the networks they create to be visualised as maps, ranging from maps of single knowledge domains right up to maps of science itself (see Börner et al. 2003; Klavans and Boyack 2009). As a result, in the sciences and to some extent the social sciences, the visualisation of disciplines and their specialties has become a recognised approach to understanding disciplines.
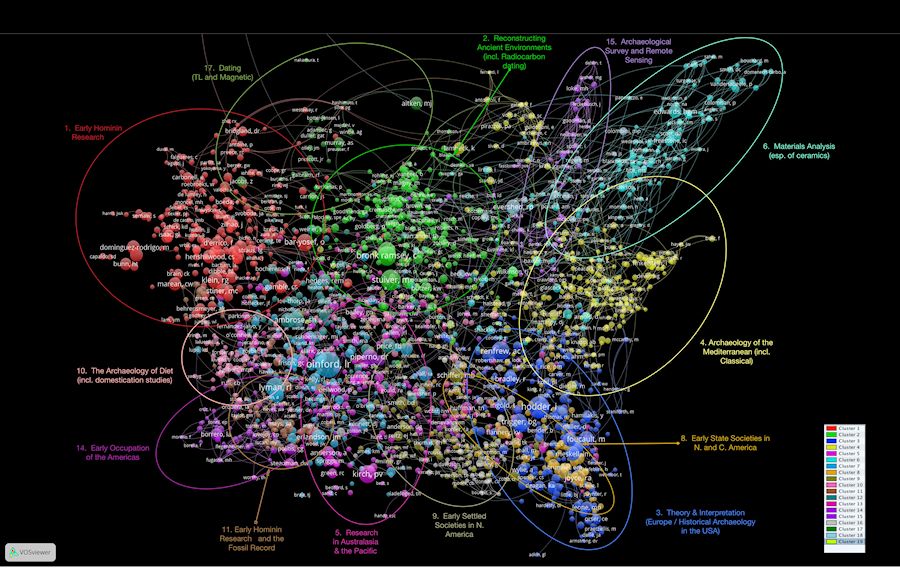
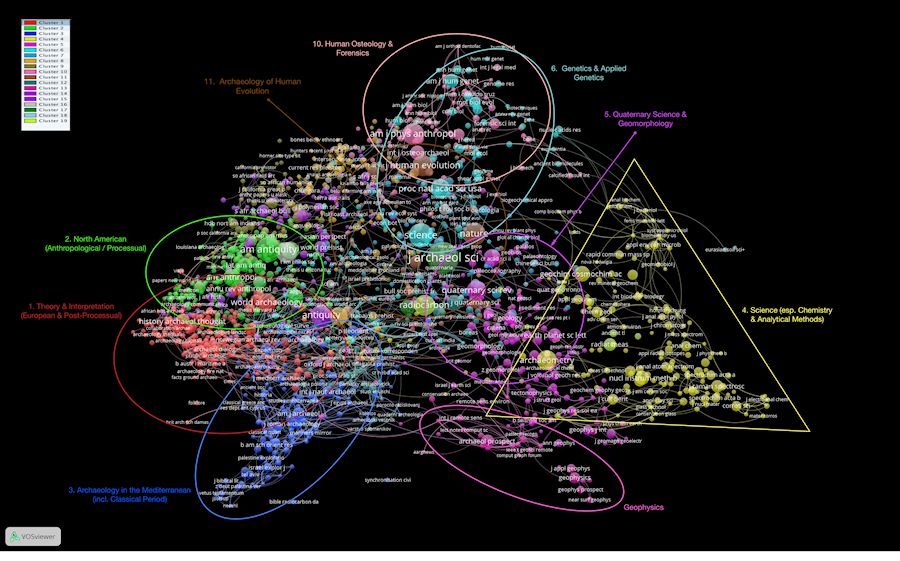
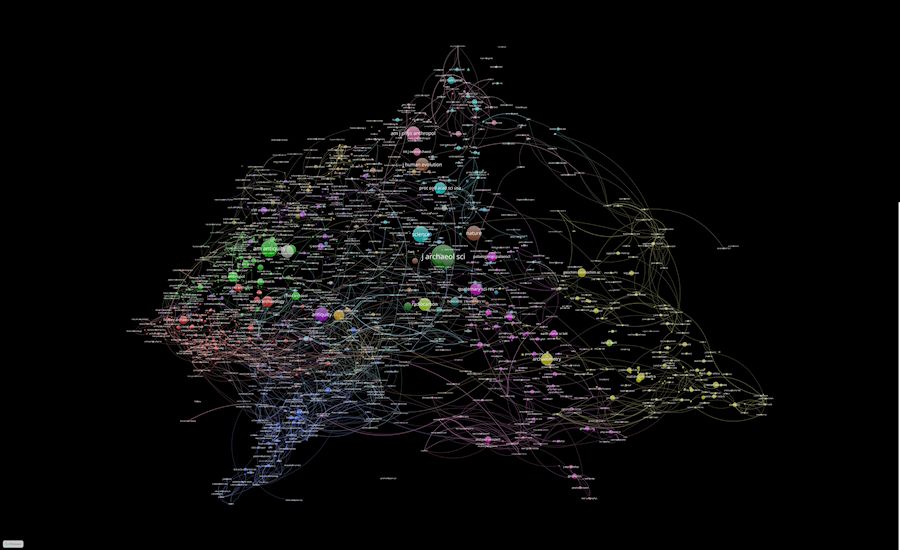
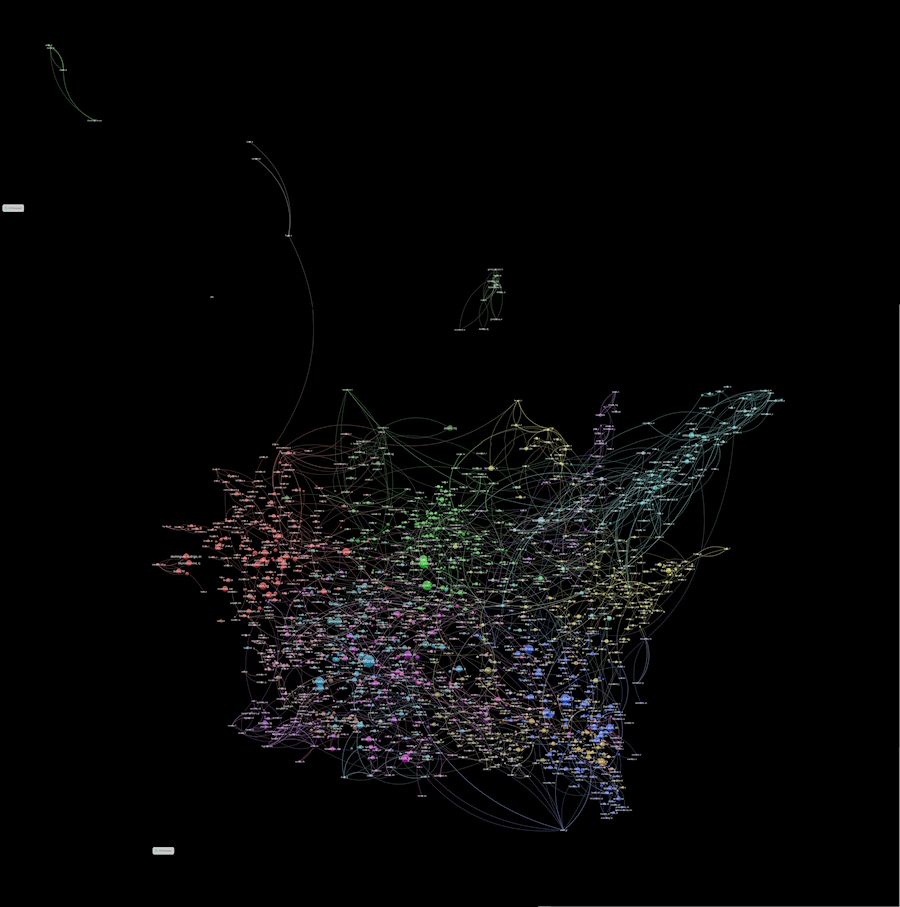
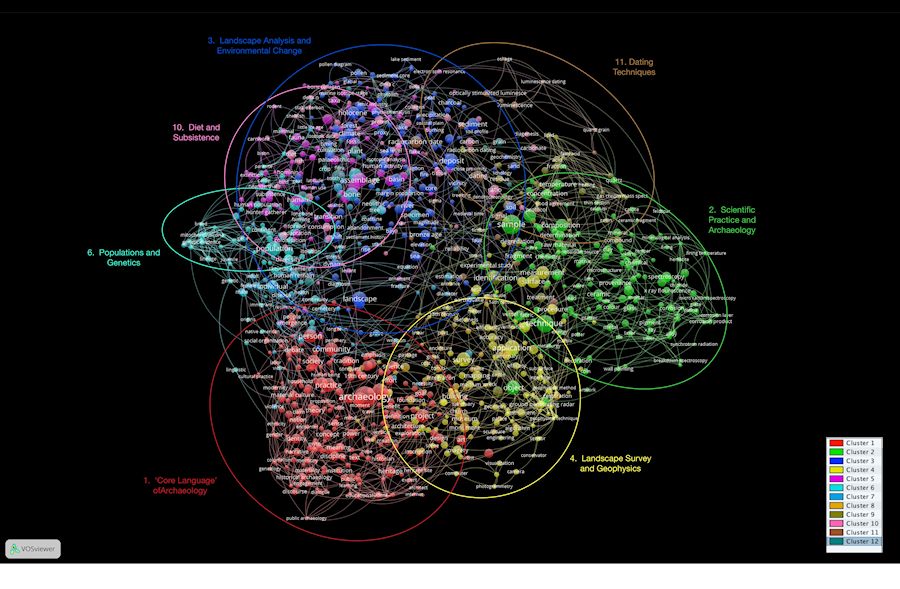
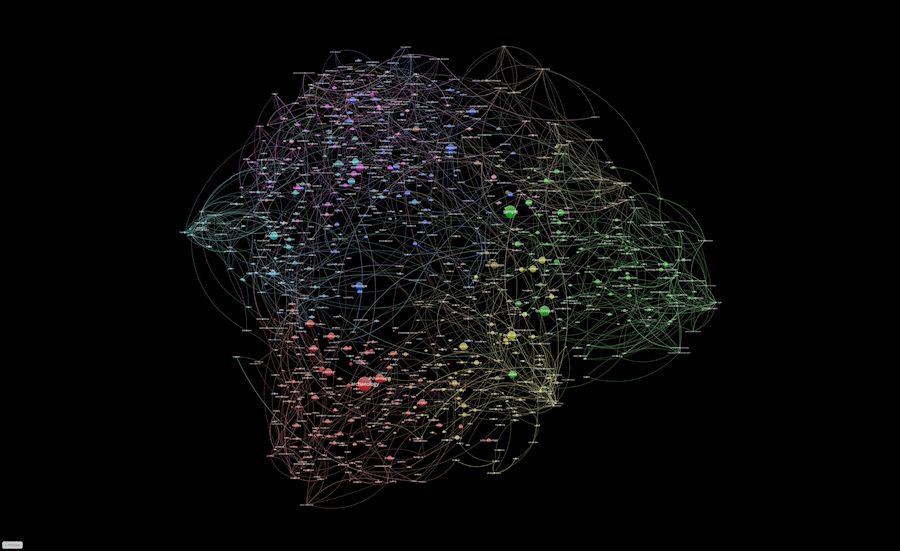
In the humanities, however, the visualisation of disciplines is very rare; most published examples focus on the arts and humanities as a form of research practice different from the sciences. A recent study by Leydesdorff et al. (2011), for example, uses citations data extracted from WoS (Web of Science) Arts and Humanities Citation Index to map subject category relations and journal-journal citation patterns across the whole of the arts and humanities. In this mapping, archaeology appears as a distinct cluster of journals or as a single subject category linked to others in this study, but for archaeological specialists these maps provide no clear detail of journal names or the subject categories to which archaeology is related, and especially no detail of any relations beyond the arts and humanities. This article presents the first bibliometric visualisations of archaeology and its practitioners based on their own citation behaviour as its starting point. Three maps of archaeology are presented: of the networks of cited sources (Figures 1 and 2), of cited authors (Figures 3 and 4)and of the use of terms (Figures 5 and 6). These maps are based on data derived from the citation indices for a set of 20,339 archaeological research documents published between 2004 and 2013. This set in turn creates links to more than 250,000 other documents within and beyond the discipline of archaeology. Each map includes more than 1000 elements ('nodes') that have been clustered into groups and placed according to the strength of their relationship with surrounding elements and clusters. These visualisations reveal in detail the range of sources, and hence disciplines, from which archaeology creates its knowledge base, and the communication patterns that archaeological researchers have evolved among themselves and with other researchers. The final map (Figure 6) also presents the first overview of the necessary terminology required to communicate archaeological research. Following presentation of the maps, I conclude with some more general discussion to address some of the questions I posed at the beginning to illustrate the manner in which such overviews permit new insights at a broad scale about the nature of archaeology as a discipline.
The approach used here offers two significant advantages for understanding the shape and structure of archaeology. Firstly, since these network maps are generated independently of the personal reading of every publication, they can now include a greater coverage of the disciplinary literature than could ever be achieved by an individual author after even a lifetime of reading. Secondly, citation-based networks, created independently of any author's predetermining theoretical interests, discourse practices, or even language limitations, have the potential to generate a much broader picture of a discipline's structure and development; although each document will necessarily have its own particular set of citations made by its author in response to many contingent factors, the aggregation of all such choices works to negate the undue effects of any particular influence. This is not possible in any narrative account by an expert, no matter how good, and is often not their purpose. In short, these maps offer comprehensive overviews of archaeology as a discipline, and can be fairly said to represent a new and original departure for grasping the shape and structure of archaeology today. They are a necessary first step in achieving an understanding of archaeology in the era of Big Science.
Internet Archaeology is an open access journal based in the Department of Archaeology, University of York. Except where otherwise noted, content from this work may be used under the terms of the Creative Commons Attribution 3.0 (CC BY) Unported licence, which permits unrestricted use, distribution, and reproduction in any medium, provided that attribution to the author(s), the title of the work, the Internet Archaeology journal and the relevant URL/DOI are given.
Terms and Conditions | Legal Statements | Privacy Policy | Cookies Policy | Citing Internet Archaeology
Internet Archaeology content is preserved for the long term with the Archaeology Data Service. Help sustain and support open access publication by donating to our Open Access Archaeology Fund.