Cite this as: Cooper, A. and Green, C. 2017 Big Questions for Large, Complex Datasets: approaching time and space using composite object assemblages, Internet Archaeology 45. https://doi.org/10.11141/ia.45.1
There has been much recent discussion about the interpretative potential, complexities and limits of archaeology's emerging 'data deluge' (Bevan 2015). Put simply, the term 'data deluge' refers to the increasing volume and forms of digital data now available to archaeologists. This phenomenon is linked to archaeology's 21st-century digital 'revolution' (e.g. Levy 2014) and moves towards open digital data (e.g. Huggett 2014; 2015). It has sparked initiatives to collate existing datasets from diverse research arenas on an unprecedented scale (resonating with the broader so-called big data movement) (e.g. Kintigh 2006; Allison 2008; Dam et al. 2010; Callou et al. 2011; see also Cooper and Green 2016), and ambitious attempts to develop systems for cross-searching disparate datasets at an international level (e.g. ARIADNE Network). Although certain aspects of the 'data deluge' have been considered in detail, interpretative accounts based on large complex digital datasets are still relatively rare. These endeavours often encounter significant data issues – complexities regarding the comparability and quality of the data compiled (e.g. Spielmann and Kintigh 2011; Atici et al. 2013; Bradbury et al. 2016). The resulting interpretative hesitancy is, therefore, understandable.
A recent study by Bevan (2012) offers a refreshing contribution in this regard. Bevan explored the broad-scale interpretative potential of two substantial UK artefact datasets – the Portable Antiquities Scheme (PAS) database (an inventory of portable material culture for England and Wales); and the Corpus of Early Medieval Coin Finds (EMC, an inventory of single early medieval coin finds). In doing so, he offered some useful initial 'statistically enthused' (Bevan and Conolly 2009, 956) and thoughtful insights into large-scale artefact distributions in the UK. Although his focus was on the investigative capacities of separate (rather than composite) artefact datasets, his emphasis on applying these – still complex – datasets to generate meaningful interpretations is important. Bevan highlighted the scope for using large digital datasets to approach significant archaeological questions. He also raised the potential for linking the findings from such analyses with insights from traditional fine-grained research.
Work undertaken on the English Landscape and Identities project (EngLaId) (Oxford, UK), adds significantly both to Bevan's initial explorations and to broader attempts to interpret large complex datasets – those comprising digital data that have been created in diverse research environments, sometimes over considerable timespans. This project has developed integrated multiscalar accounts of the English landscape from 1500 BC–AD 1086 drawing on a database of almost one million records of archaeological artefacts, monuments and investigations logged within national and local repositories and within individual researchers' databases, some of which have been curated over at least a 150-year period (see Cooper et al. forthcoming for the overall project findings). Monuments referred to in this study represent 'types' (e.g. villa) or 'classes' (e.g. agriculture and subsistence) of archaeological activity as they are recorded in UK data repositories, rather than exclusively to monumental archaeological features (e.g. long barrow, temple, etc.). Our engagement with this impressive data assemblage places us in a powerful position to comment on the character and capacities of English archaeological data and has given us a unique insight into the practicalities of handling substantial integrated datasets much more widely. A detailed consideration of the (necessary) complexity of English archaeological data, including an assessment of the degree of overlap between key datasets at a national and regional level is given in Cooper and Green (2016). Our aim in that paper was to frame data intricacies in a positive light (such issues are by no means exclusive to archaeology) and to foreground the importance of working interpretatively with complex digital data. In a subsequent article, the EngLaId team debated the potential role played by different interpretative possibilities – research histories, topography, population dynamics, etc. – in creating very broad-scale spatial patterns in English archaeological data as a whole (Green et al. 2017). The study presented here focuses much more specifically on the analytical capacities of English artefact data – a key and interpretatively very interesting element of the EngLaID dataset that deserves consideration in its own right.
The following account draws mainly on data from one substantial national-level artefact dataset (the PAS). These data are augmented, where relevant, with artefact evidence from the EMC and from composite archaeological inventories (those that include monuments and events as well as objects) at a national and regional level. In using these data interpretatively, one key aim was to connect directly with current themes in UK artefact research (much of which draws heavily on PAS data). In doing so we were able not only to expand on and to contextualise existing detailed interpretations from a broad-scale perspective, but also to approach significant interpretative issues – time, space, formation processes, and the relationship between broad-scale and local patterning – that resonate right across archaeology, well beyond artefact studies. Extending arguments made by Bevan (2012; 2015), our findings highlight the vital role that digital modelling can play in realising the interpretative scope of large complex datasets. We also highlight the extremely productive outcomes of linking archaeological assemblages that have previously been approached separately, and of drawing on ideas from distinct research specialisms. Most importantly, we contend, large complex datasets not only lead us to address interpretative issues at a different scale but they also require us to think differently – a new set of theoretical and ethical concerns are raised, and the emphasis of critical attention shifts.
Our overall intention is to develop coarse-grained methods for analysing large, complex digital artefact data that appeal (and are also accessible) to the statistically and the object-enthused alike. The findings will, we hope, be of key interest to researchers undertaking artefact studies in the UK. However our 'bottom-up' approach to addressing large complex digital datasets (using the strengths of existing research themes to build new interpretative perspectives), our multiscalar interpretative agenda, our endeavour to link typically separate research realms, and the computational methods put forward in themselves, have clear repercussions much more broadly. As mentioned above, the questions of how to employ meaningfully the burgeoning and somewhat unwieldy mass of digital data, and of how to connect broad-brush computational analysis with the findings of traditional fine-grained research are currently vital matters for researchers both within and well beyond archaeology. This study takes positive, practical steps towards addressing such matters.
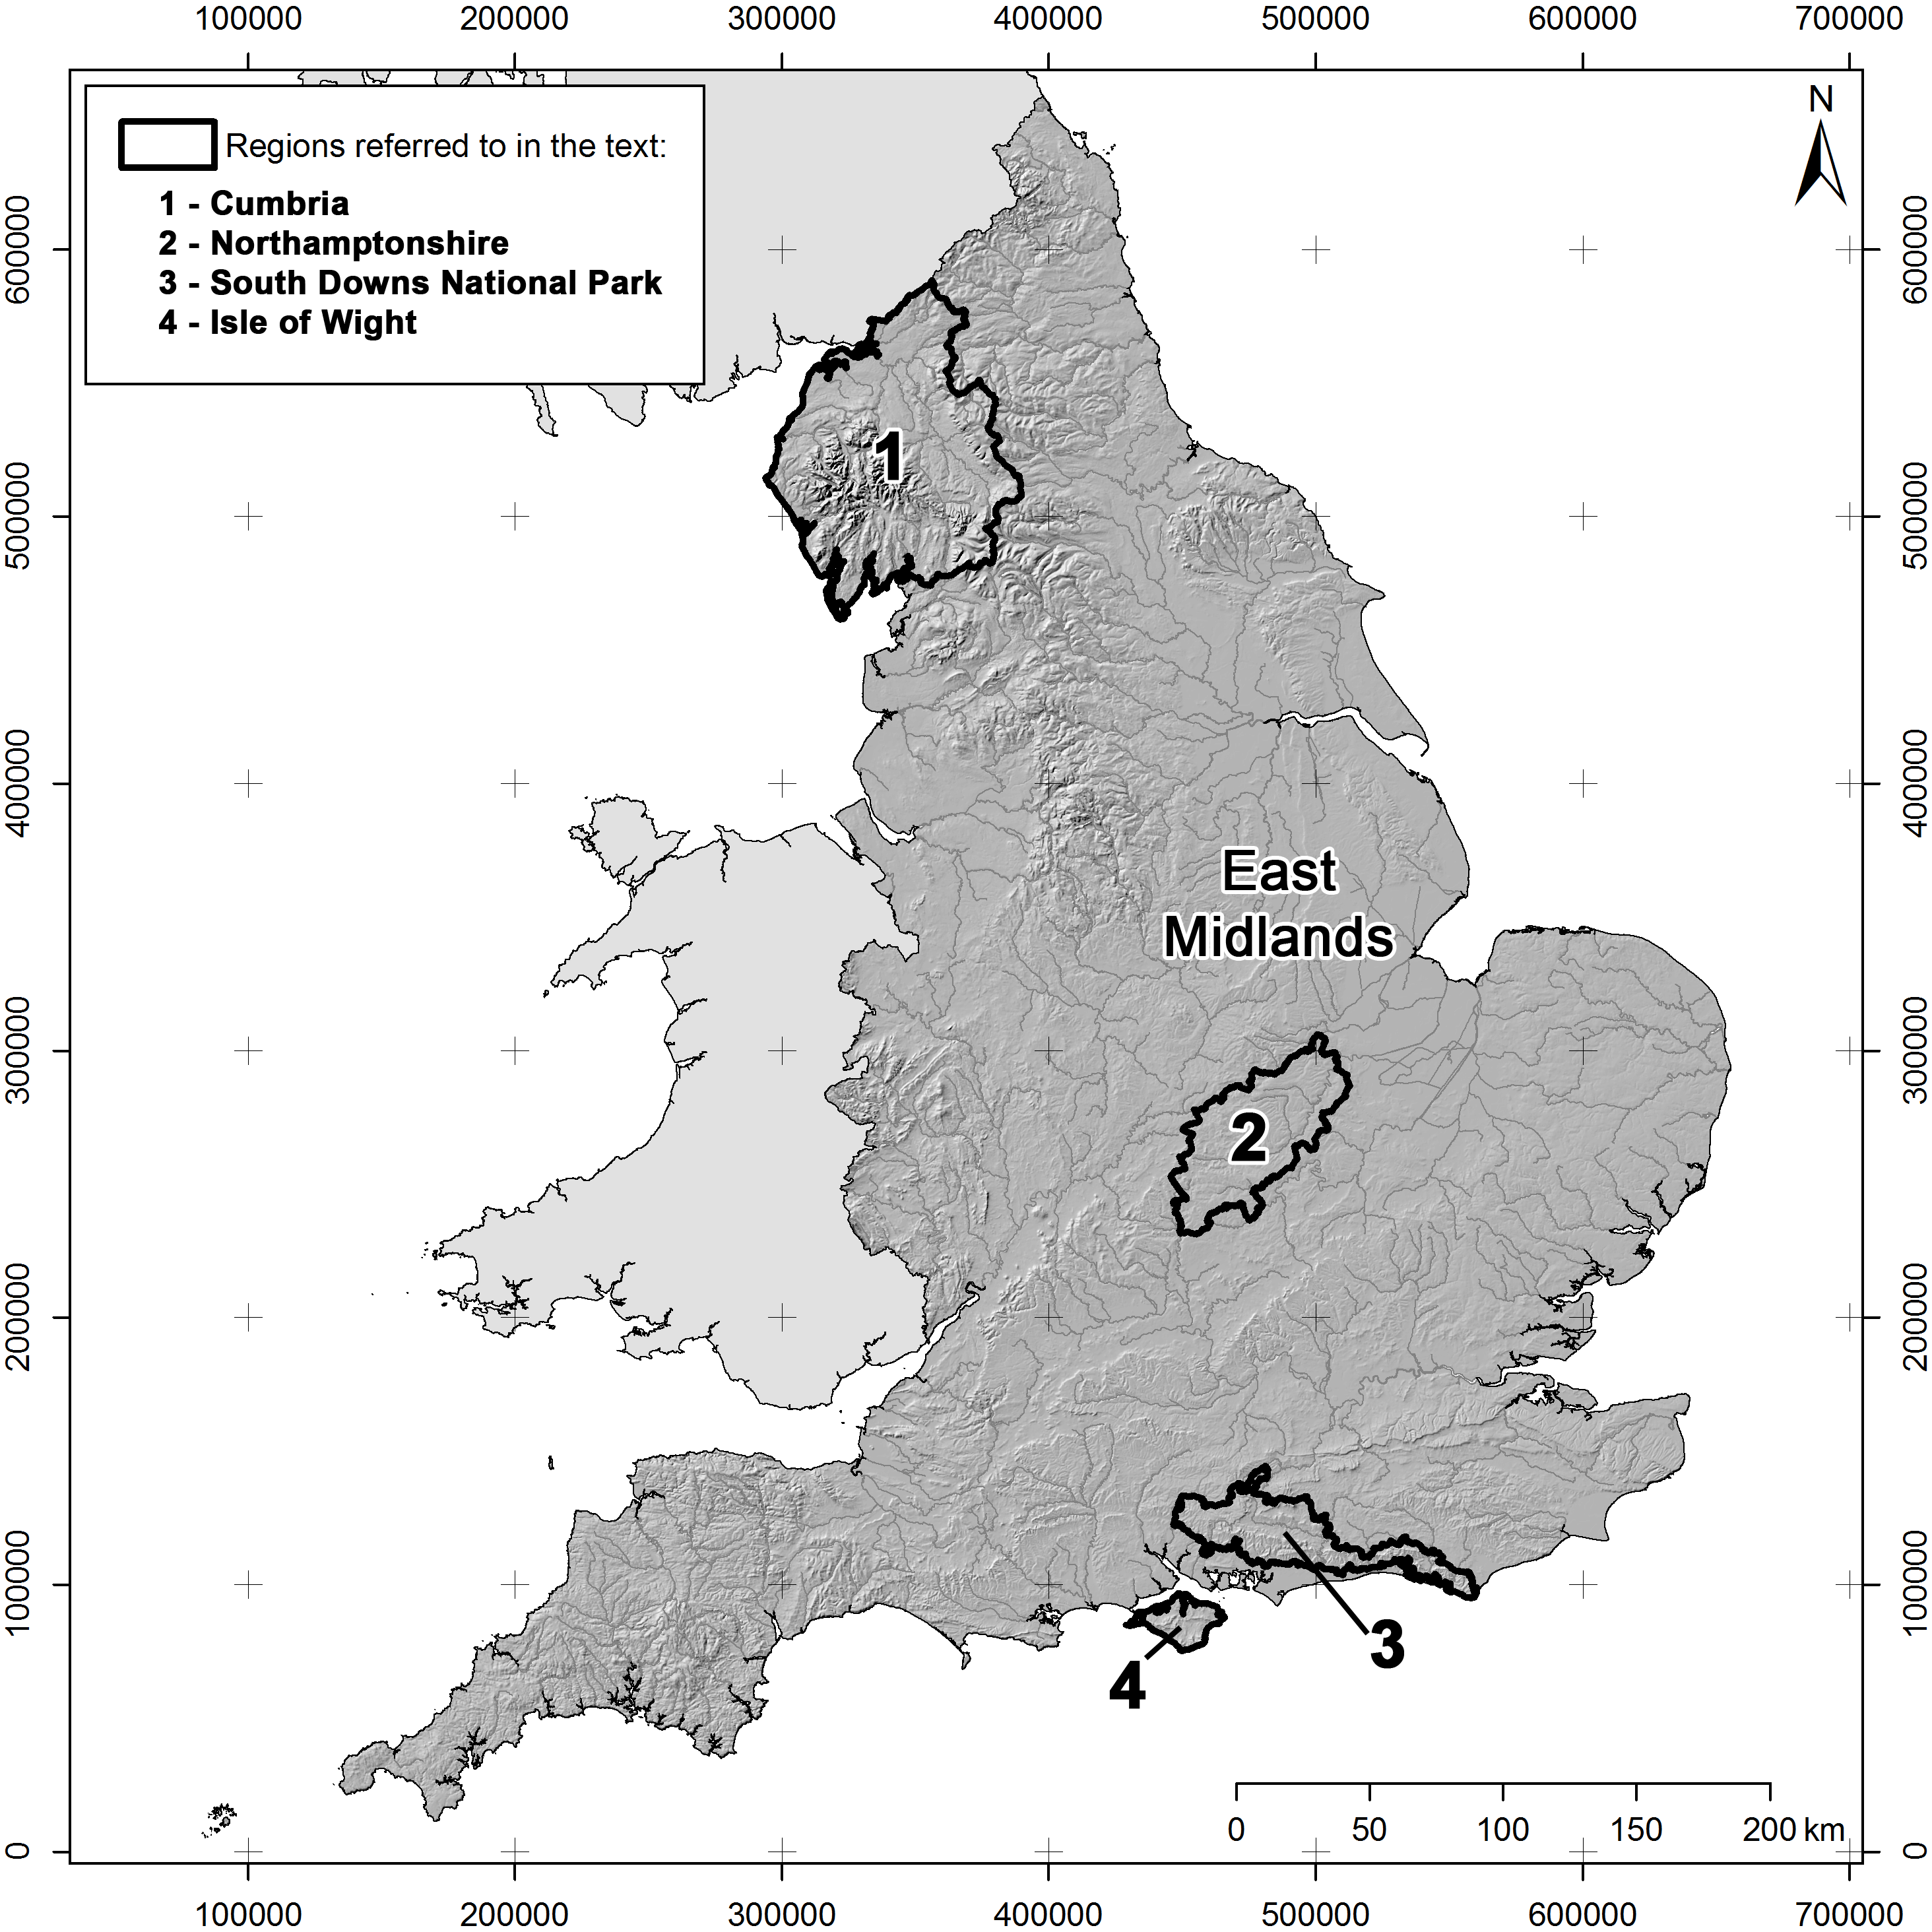
The following account operates at two main levels: national-level patterning (covering England) is juxtaposed with patterning generated within one specific region – the Isle of Wight (Figure 1). This region was chosen in part because of its centrality in recent artefact-based studies (Robbins 2012; Walton 2012; Wellington 2001). The PAS has also been particularly fruitful on the Isle of Wight owing to the long-term redoubtable input of local professionals and metal detectorists (Basford 2007; Robbins 2013).
At a national level, we focus on evidence from the PAS database. In brief, the PAS database represents a unique and highly successful response within the UK to a shift in the legislation for dealing with archaeological 'Treasure' during the 1990s (see PAS website for a simple explanation). The PAS created for the first time a formal system for recording artefact discoveries (including both precious and non-precious metal objects and other archaeological finds) made primarily by members of the public. Since its inception in 1997 (and expansion in 2003 to cover all of England and Wales), almost 750,000 PAS records have been created, relating to over one million separate objects (mostly metalwork finds). This initiative has undoubtedly fuelled a major resurgence in artefact-based studies in the UK – the PAS website currently lists 456 derivative research projects operating at a range of scales, and generated in various working contexts. It is also worth noting that although the PAS database is unparalleled at a worldwide level in its specific history and makeup (particularly since metal detecting is banned in many countries; see Bland 2005 for a useful summary), it is certainly not the only ongoing attempt to assemble diverse artefact data on a substantial scale (e.g. http://artefacts.mom.fr/). Consequently themes relating to the use of this dataset have resonance much more broadly.
For the Isle of Wight, PAS database records were aligned with artefact records from the EMC, Historic England's National Record of the Historic Environment (NRHE) and from the Isle of Wight's Historic Environment Record (HER). While it would have been very interesting also to include evidence from museum databases, this was beyond the scope of our study. See Farley (2012) for an impressive attempt to build an integrated database of over 14,500 records using artefact data from HERs, the PAS, published sources and museum databases for the late Iron Age and early Roman period in the East Midlands region, UK. It is also worth noting that English HERs do often hold and use PAS data as a separate dataset. However, we regard this as somewhat different to integrating these data fully within the main HER dataset.
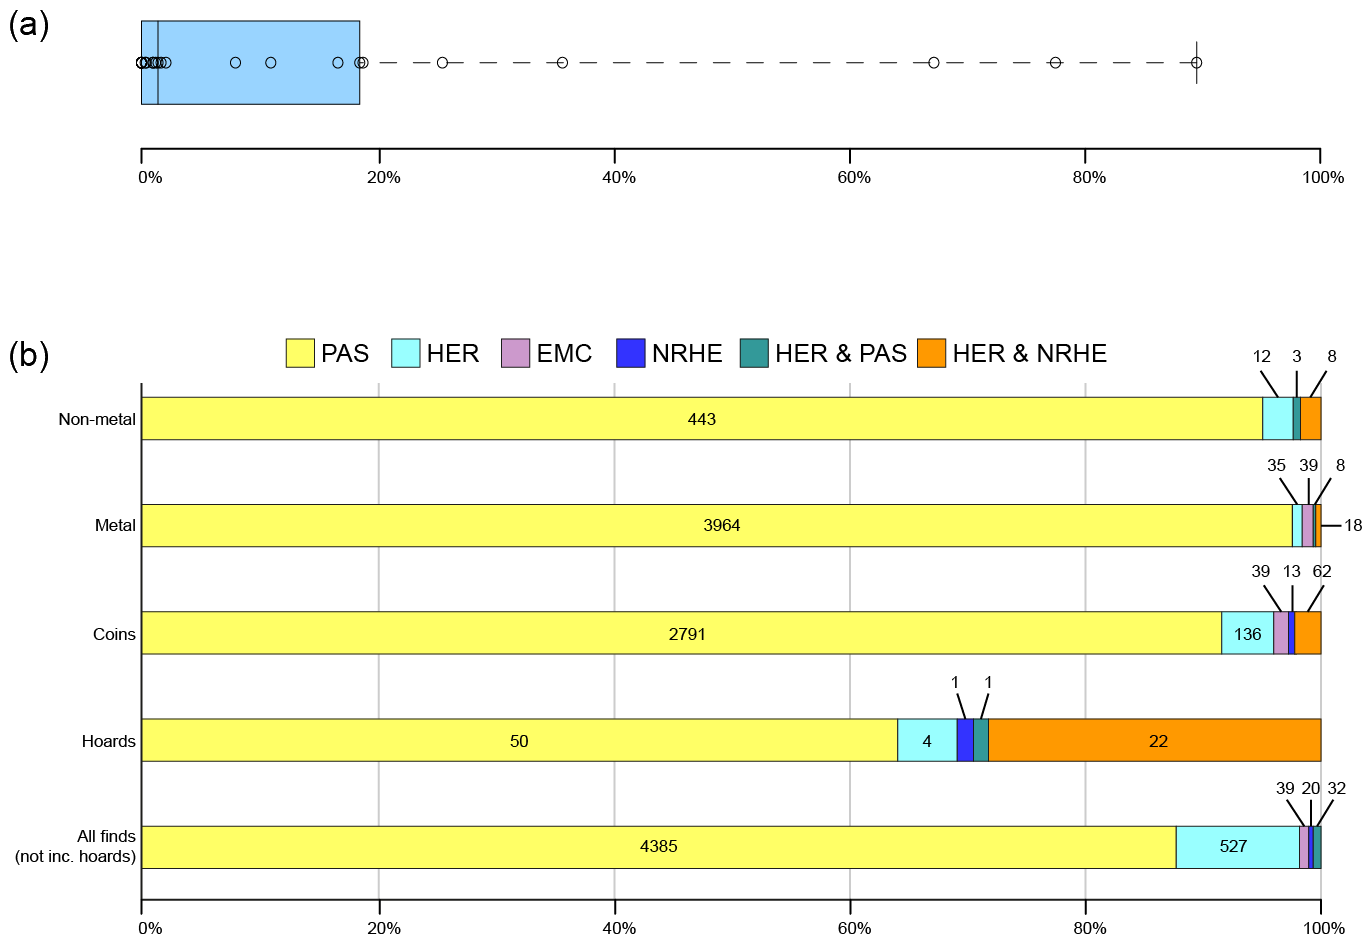
Overlaps between the datasets were removed – although only around 1% of PAS records were duplicated in the HER for the Isle of Wight, the degree of overlap varies considerably across England (Figure 2a). Additionally, information from general descriptive fields in HER and NRHE records (artefact types, dating information, materials etc.) was used to populate designated finds description fields within the EngLaId database in order to make these records compatible with those within the PAS/EMC databases. For some artefact types this integration process had little effect – the vast majority of Iron Age and Roman coins are logged only within the PAS database (Figure 2b). However, other object types (in particular non-metal finds such as flint, pottery, architectural materials etc.) and modes of deposition (hoards) are sometimes represented much more reliably within composite archaeological inventories. Consequently, at a regional level it is essential interpretatively to undertake this integrative process.
One significant point to take from this exercise is that no comprehensive database of artefacts exists in English archaeology. Moreover, since the work involved in integrating the separate inventories is arduous, and given that the information recorded in different object inventories is often complementary rather than directly overlapping, researchers have adopted various strategies for handling this situation (see Farley 2012, 251-5; Walton 2012, 116; Daubney 2015, 45-6, for further discussions of this issue). An appreciation of these complexities is undoubtedly vital to ongoing attempts to create a centralised, national-level digital record for archaeology in the UK.
In what follows, we use as analytical starting points three common features of recent UK artefact studies (in particular those that have drawn on PAS data) that we felt could be developed productively using computational methods. Most recent studies consider in detail key modern and environmental factors that shape artefact distributions. Researchers working mainly with coin assemblages have developed sophisticated methods for investigating temporal patterning in object loss/deposition. More broadly, an array of methods has been offered for identifying meaningful concentrations of activity (or 'sites') that can provide a focus for more detailed analysis, particularly at a regional or 'landscape' scale. For each of these themes, insights from recent UK artefact studies are reviewed. Where relevant, discussions and approaches from artefact analyses more broadly are raised. New computational models are then outlined, and initial interpretative implications are discussed at both national and regional levels.
The models put forward make an innovative contribution to work in this area. They are also necessarily bold, broad-brush and tailored for coarse-grained analysis – they are intentionally provisional and open to further refinement and experimentation. In this open experimental vein, wherever possible, the data and processes employed in these models and related images are made available as supplementary material such that they can be tested and developed by others.
Discussions about factors that shape the creation of material distributions – both on the ground and in their collection for analysis – have long been integral to artefact studies and to archaeological analyses more broadly (e.g. Cherry et al. 1978; Collins 1975; Flannery 1976; Haselgrove et al. 1985; Schiffer 1987; Orton 2000). However, the emergence of the PAS database has prompted a new wave of dialogue about this issue (e.g. Chester-Kadwell 2009; Richards et al. 2009; Bevan 2012; Farley 2012, 251; Robbins 2012; 2013; 2014; Walton 2012; Brindle 2014; Daubney 2015, 53-5). This is linked mainly to the fact that, in contrast to detailed systematic landscape surveys that have been a key component of archaeological research since at least the 1970s, PAS data are collected neither systematically (according to a predefined research plan) nor predominantly by professional archaeologists (Robbins 2013, 56). Unsurprisingly, therefore, the emphasis of recent discussions has been on identifying modern factors that influence how metal-detected objects are collected and recorded, rather than on broader complexities involved in the creation of surface artefact scatters – a mainstay of earlier work in this area. Important elements highlighted in Robbins' extensive research on this topic (summarised in 2013; 2014, 40-6) include:
In practice, researchers have understandably highlighted slightly different influencing factors according to the specificities of their own study. The broad aim has been to identify and ultimately to eliminate these biases such that the data can be employed 'more effectively' (Robbins 2013, 71). Two interesting (and related) attributes of this work are, firstly, that different influencing factors are usually mapped separately, and secondly that artefact distributions are often plotted separately to the factors thought to have shaped them (e.g. Bevan 2012, 495; see, however, Richards et al. 2009), making comparison difficult. Rather than adding to attempts to hone understandings of factors influencing artefact distributions in general and PAS data in particular (well-worn topics), our own interest is in extending this work theoretically and practically in a way that is useful much more broadly.
First, with the aim of emphasising the constructive contribution that data complexities can make to the interpretative process (Cooper and Green 2016), we suggest that factors involved in the creation of substantial artefact inventories can be viewed more positively – not as 'constraints', 'limits' or 'biases' impinging on the 'true' patterning of past practices, but as opportunities or 'affordances' that are integral to this patterning.
The concept of 'affordance' was devised by Gibson (1977; 1979), introduced into landscape archaeology by Ingold (1992) and helpfully summarised by Gillings (2007, 38-9). Essentially, affordances are opportunities provided to people by their environment in the context of their practical activity. They can be either actual or potential. The concept has been used as a way of escaping the oppositional culture/nature relationship between humans and landscape, providing a more mutual basis for the relationship and encouraging an explicit appreciation of the inhabited nature of landscape: 'Rather than a 'backcloth', a much more profitable and rewarding way of approaching the issue is to consider human occupancy as part of the very weft and weave of the … environment' (Gillings 2007, 39).
Although primarily used as a theoretical approach to understanding past practices, affordance can also be applied as a concept to the various (human and natural) factors that structure our record of the past. In this sense, we can usefully conceive of factors that influence (partially) the structure of artefact distributions, such as those discussed above, as affordances rather than as limits or constraints: the environment offers affordances to those involved in collecting artefacts (e.g. metal detectorists) that determine their success in discovering archaeological material. These affordances and the agency of the finder (e.g. in deciding where to search) contribute to the spatial structure of the resulting artefact distributions. The agency element is largely unquantifiable, but if we develop a reasonable understanding of the affordance element (an attribute that might alternatively be termed 'recovery potential'), we can begin to assess the role of modern factors in structuring artefact patterning.
Second, and more practically, at one level it is necessary (and more statistically robust) to consider the effects of various factors that influence artefact distributions separately as many researchers have done previously. In certain contexts, however, we suggest it is also interpretatively extremely important to generate an understanding of the combined effects of these factors. Only by doing so is it possible to gain an overall sense of how different influencing factors (e.g. geological formations and modern activities) work in combination in shaping artefact distributions – surely a vital and interesting (if also complex) issue to address. Obviously it is not possible (or necessarily desirable) to integrate each and every factor involved in creating large-scale artefact distributions. For instance, at least two of the factors that Robbins (2013) suggested played a significant role in shaping the PAS dataset – distance from very active metal detectorists' homes, and landowner permission to access land – cannot feasibly be plotted at a national level. Rather our approach is pragmatic – we focus here on three broad sets of affordances that are widely accepted to have influenced the creation of the PAS database and that are also relatively easy to visualise at various spatial scales:
The authors did make a concerted attempt to gather data about the density of metal-detecting activity across England. However, this aspect of the PAS data creation process is notoriously difficult to determine. Information provided from Katie Robbins (pers. comm.) regarding her national survey of metal-detecting densities in 2014, from 7 separate Finds Liaison Officers who responded to our email survey in September 2016, and from our initial analysis of PAS data for finds and finder numbers from across England, suggested that it would not be productive to include this information in our model.
Factors that obscure the ground surface – combined here under the term 'obscuration' – include those that cover the ground entirely (e.g. buildings) and those that make artefact discovery difficult (e.g. woodland). These were mapped nationally using the Ordnance Survey's OpenData Vector Map dataset. Other factors that should prevent artefact discovery are more specific to metal detecting. For instance, metal detecting is illegal on Scheduled Ancient Monuments, on Forestry Commission land, and in ancient woodland, country parks, local nature reserves, national parks, Ramsar sites, and Sites of Special Scientific Interest. All these factors were combined here to produce a map of areas where metal detecting is extremely difficult or impossible. In order to make a usable affordance map from this data, a kriged surface (O'Sullivan and Unwin 2010, 293-311) was created based upon the percentage obscuration/constraint of 1x1km grid cells across England.
The influence of modern land use was assessed by creating a simplified land use classification using the Centre for Ecology and Hydrology's Land Cover Map 2007. The distribution of PAS find spots was tested against this map to quantify the percentage of finds associated with each land use category (Table 1). Unsurprisingly, the majority of findspots occurred on arable land (69%), followed by grassland (21%). A chi-squared test of the percentage distribution of land-use types for PAS findspots against the overall percentage of England covered by each land-use type gave a p-value of 0.232, rejecting the null hypothesis that the PAS distribution might simply reflect the overall distribution of land cover. As the relationship was proven to be statistically significant, a weighted surface was created based upon this quantification and the land cover map, with arable areas being given a weighting of 1.00 (being mostly likely to produce PAS finds) and other areas being given a weighting relative to 1.00 based upon their relative percentages (e.g. grassland was given a weighting of 21.33 ÷ 69.14 = 0.31). This surface then provides a useful proxy model for the relationship between land use and the distribution of PAS findspots.
| Land use | % of England | % PAS records | Model weighting |
|---|---|---|---|
| Arable | 39.65% | 69.14% | 1.00 |
| Grassland | 33.83% | 21.33% | 0.31 |
| Suburban | 6.77% | 4.19% | 0.06 |
| Woodland | 9.21% | 2.83% | 0.04 |
| Urban | 1.91% | 1.12% | 0.02 |
| Water | 1.29% | 0.57% | 0.01 |
| Sediment | 0.84% | 0.37% | 0.01 |
| Rock | 0.40% | 0.17% | 0.00 |
| Upland | 2.97% | 0.15% | 0.00 |
| Unclassified | 1.61% | 0.11% | 0.00 |
| Wetland | 1.52% | 0.03% | 0.00 |
Understandings of the role played by known archaeological sites in the discovery of metal-detected finds vary significantly. Formal surveys (Robbins 2012; Brindle 2014) suggest that metal detectorists rarely consider the location of known archaeological sites in choosing where to metal detect. However, more finds are certainly made in the vicinity of known archaeological sites (Robbins 2013, 61; 2014, 67-8) – a pattern that could easily relate to higher levels of activity in these locations both in the past, and recently by metal detectorists. The recent rise in metal-detecting magazine adverts and mobile phone apps for databases of archaeological sites also certainly implies that practitioners are well aware of and probably also choose where to metal detect according to the known distribution of archaeological sites. We made our own basic assessment of the spatial relationship between known archaeological monuments and PAS findspots by comparing evidence recorded in the EngLaId database with that recorded in the PAS database. Records from each dataset were mapped on a presence/absence basis within 1x1km grid cells (e.g. Green 2013) using the broad monument classes employed within the EngLaId database. Cells recording a findspot of the same period were counted and percentages of co-occurrence calculated (Table 2). Since Roman sites of all types and early medieval funerary sites in particular showed a spatial correlation with PAS records of the same date, proximity to these monuments was built into an affordance model. A kernel density estimate (KDE) surface (O'Sullivan and Unwin 2010, 68-71) was created for these site types and reclassified to cut off at the first quartile (0.1226 out of 1.0) as the correlation was not particularly strong. A refinement of this model might include Scheduled Ancient Monuments as high gravitational attractors for metal-detecting activity (albeit outside of the scheduled areas themselves) or perhaps even existing known concentrations of PAS material, especially now that the scheme is well established.
| Monument class/type | Later Bronze Age | Iron Age | Roman | Early medieval |
|---|---|---|---|---|
| Agriculture and subsistence | 11.8% | 17.3% | 30.5% | 10.6% |
| Religious, ritual and funerary | 10.2% | 31.6% | 43.6% | 33.5% |
| Funerary only | 10.9% | 32.6% | 45.4% | 39.6% |
| Domestic and civil | 17.0% | 20.5% | 33.8% | 21.8% |
| Architectural forms | 10.7% | 24.8% | 38.2% | 24.0% |
| Villas only | n/a | n/a | 45.3% | n/a |
| Industrial | 23.2% | 34.0% | 40.5% | 23.5% |
| Communication and transport | 18.3% | 20.8% | 24.8% | 16.3% |
| Defensive | 19.4% | 14.0% | 37.6% | 19.6% |
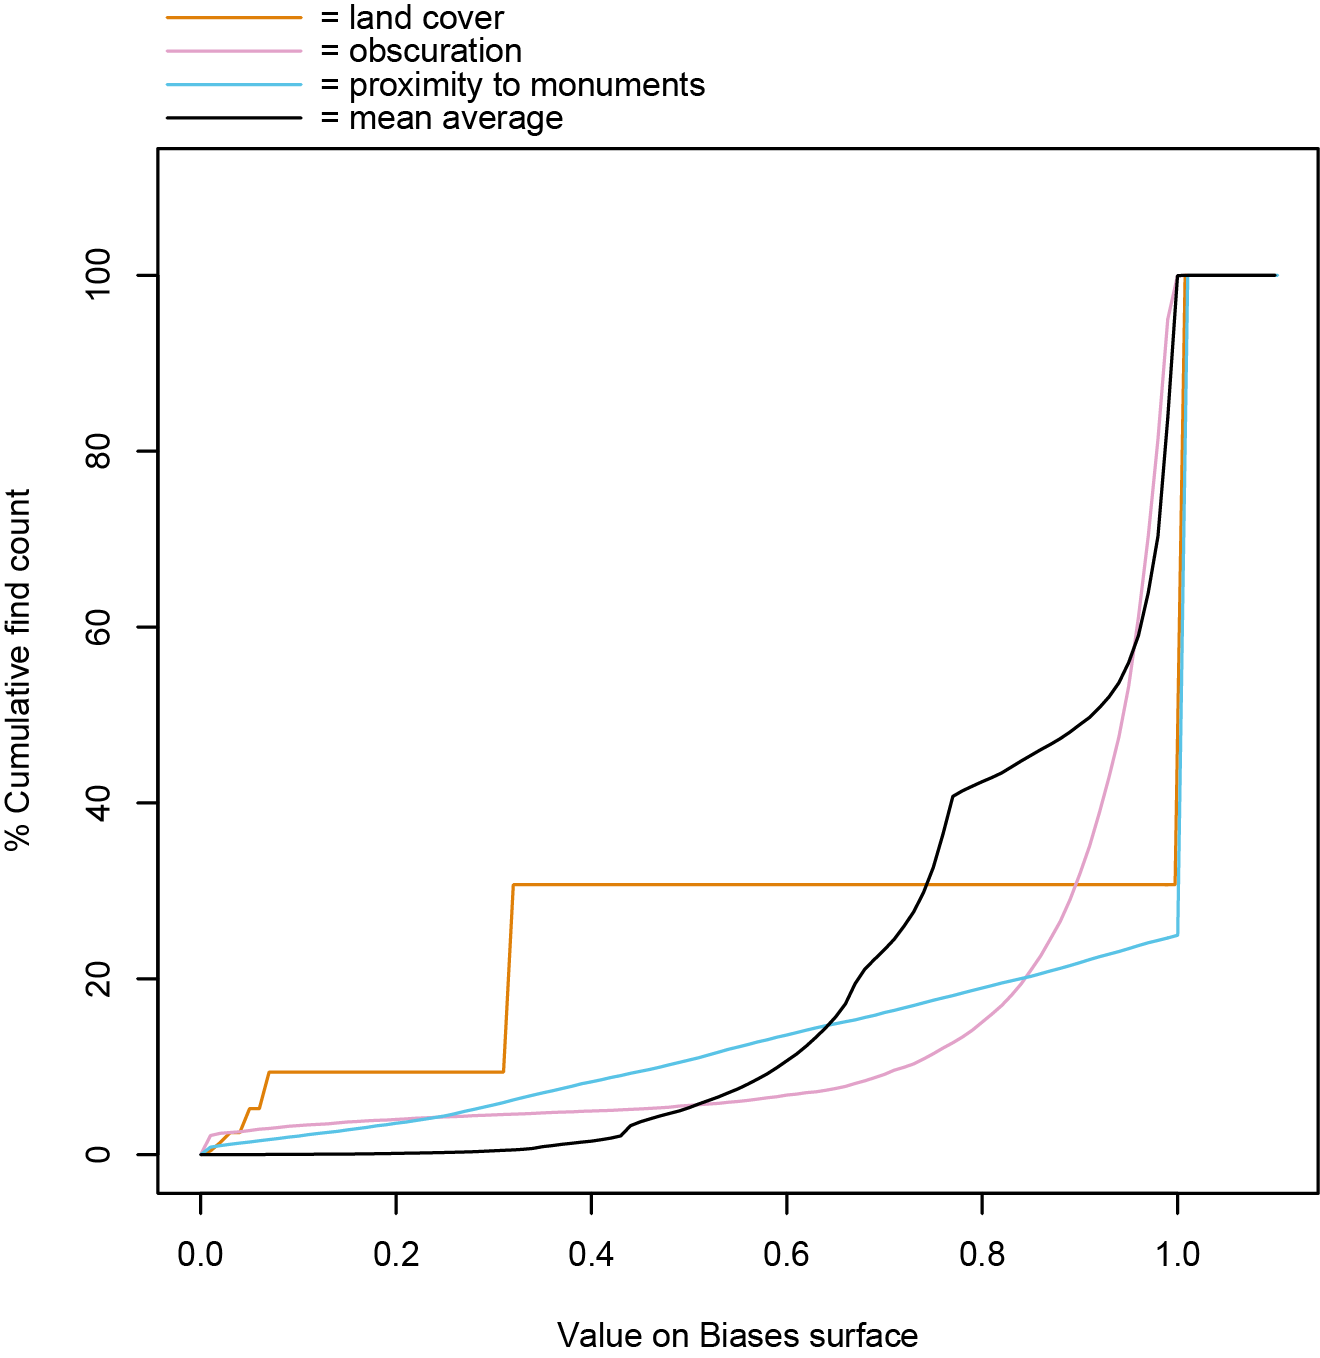
When examined graphically (Figure 3), it is apparent that 'obscuration' has a very strong effect on PAS distributions (unsurprisingly as this model largely operates on an 'all or nothing' basis), land cover has a strong effect, and proximity to known sites a relatively weak effect. Having verified the overall correspondence between favourable land and the location of PAS records, we combined the three elements of affordance into a composite affordance model for PAS finds in England by calculating a simple mean average of the three surfaces for each 100m cell (Figure 4). The resulting surface was then smoothed using a 3x3 cell mean function to increase the fuzziness of the resulting model. This was intended to reflect the model's ultimately rough-hewn nature. This model was then overlaid with a KDE surface of the distribution of actual PAS findspots (Figure 5). It is worth noting that the model does incorporate a degree of 'double jeopardy': some areas given low affordance in the land use element are also given low affordance in the obscuration element (e.g. water bodies). However, this does not invalidate the result – one could even argue that it would genuinely be doubly difficult to discover artefacts in these areas.
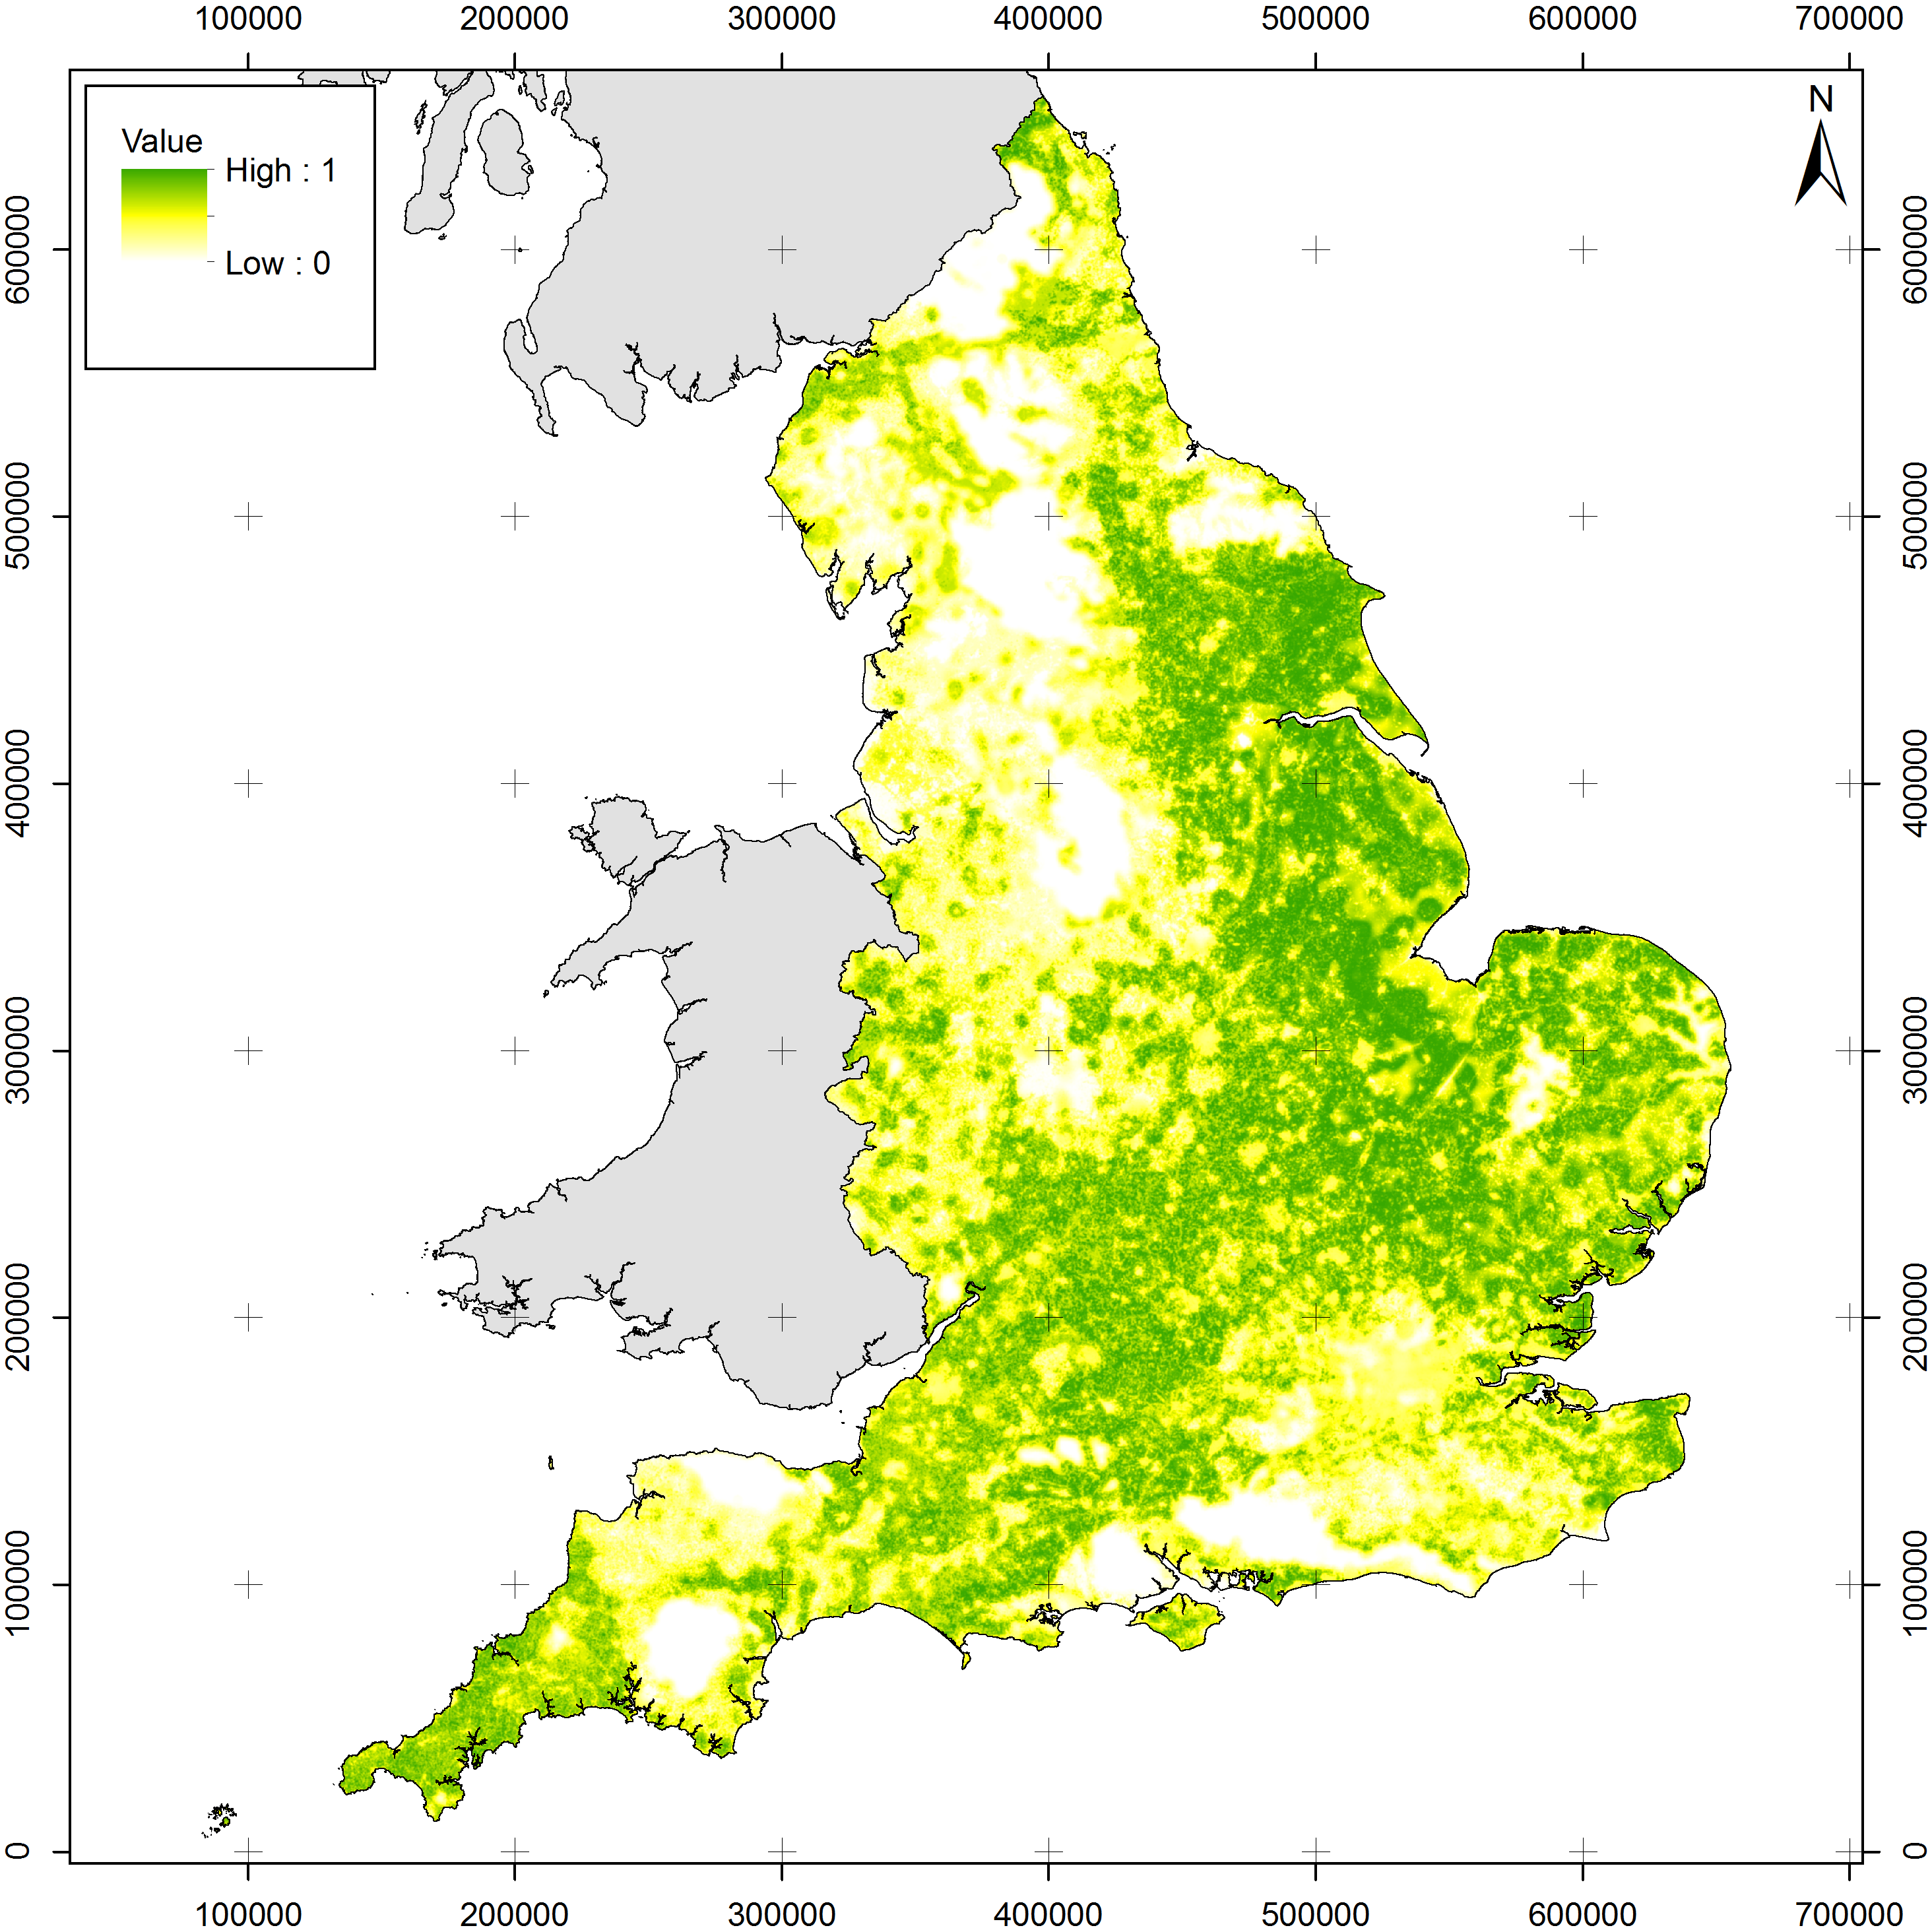
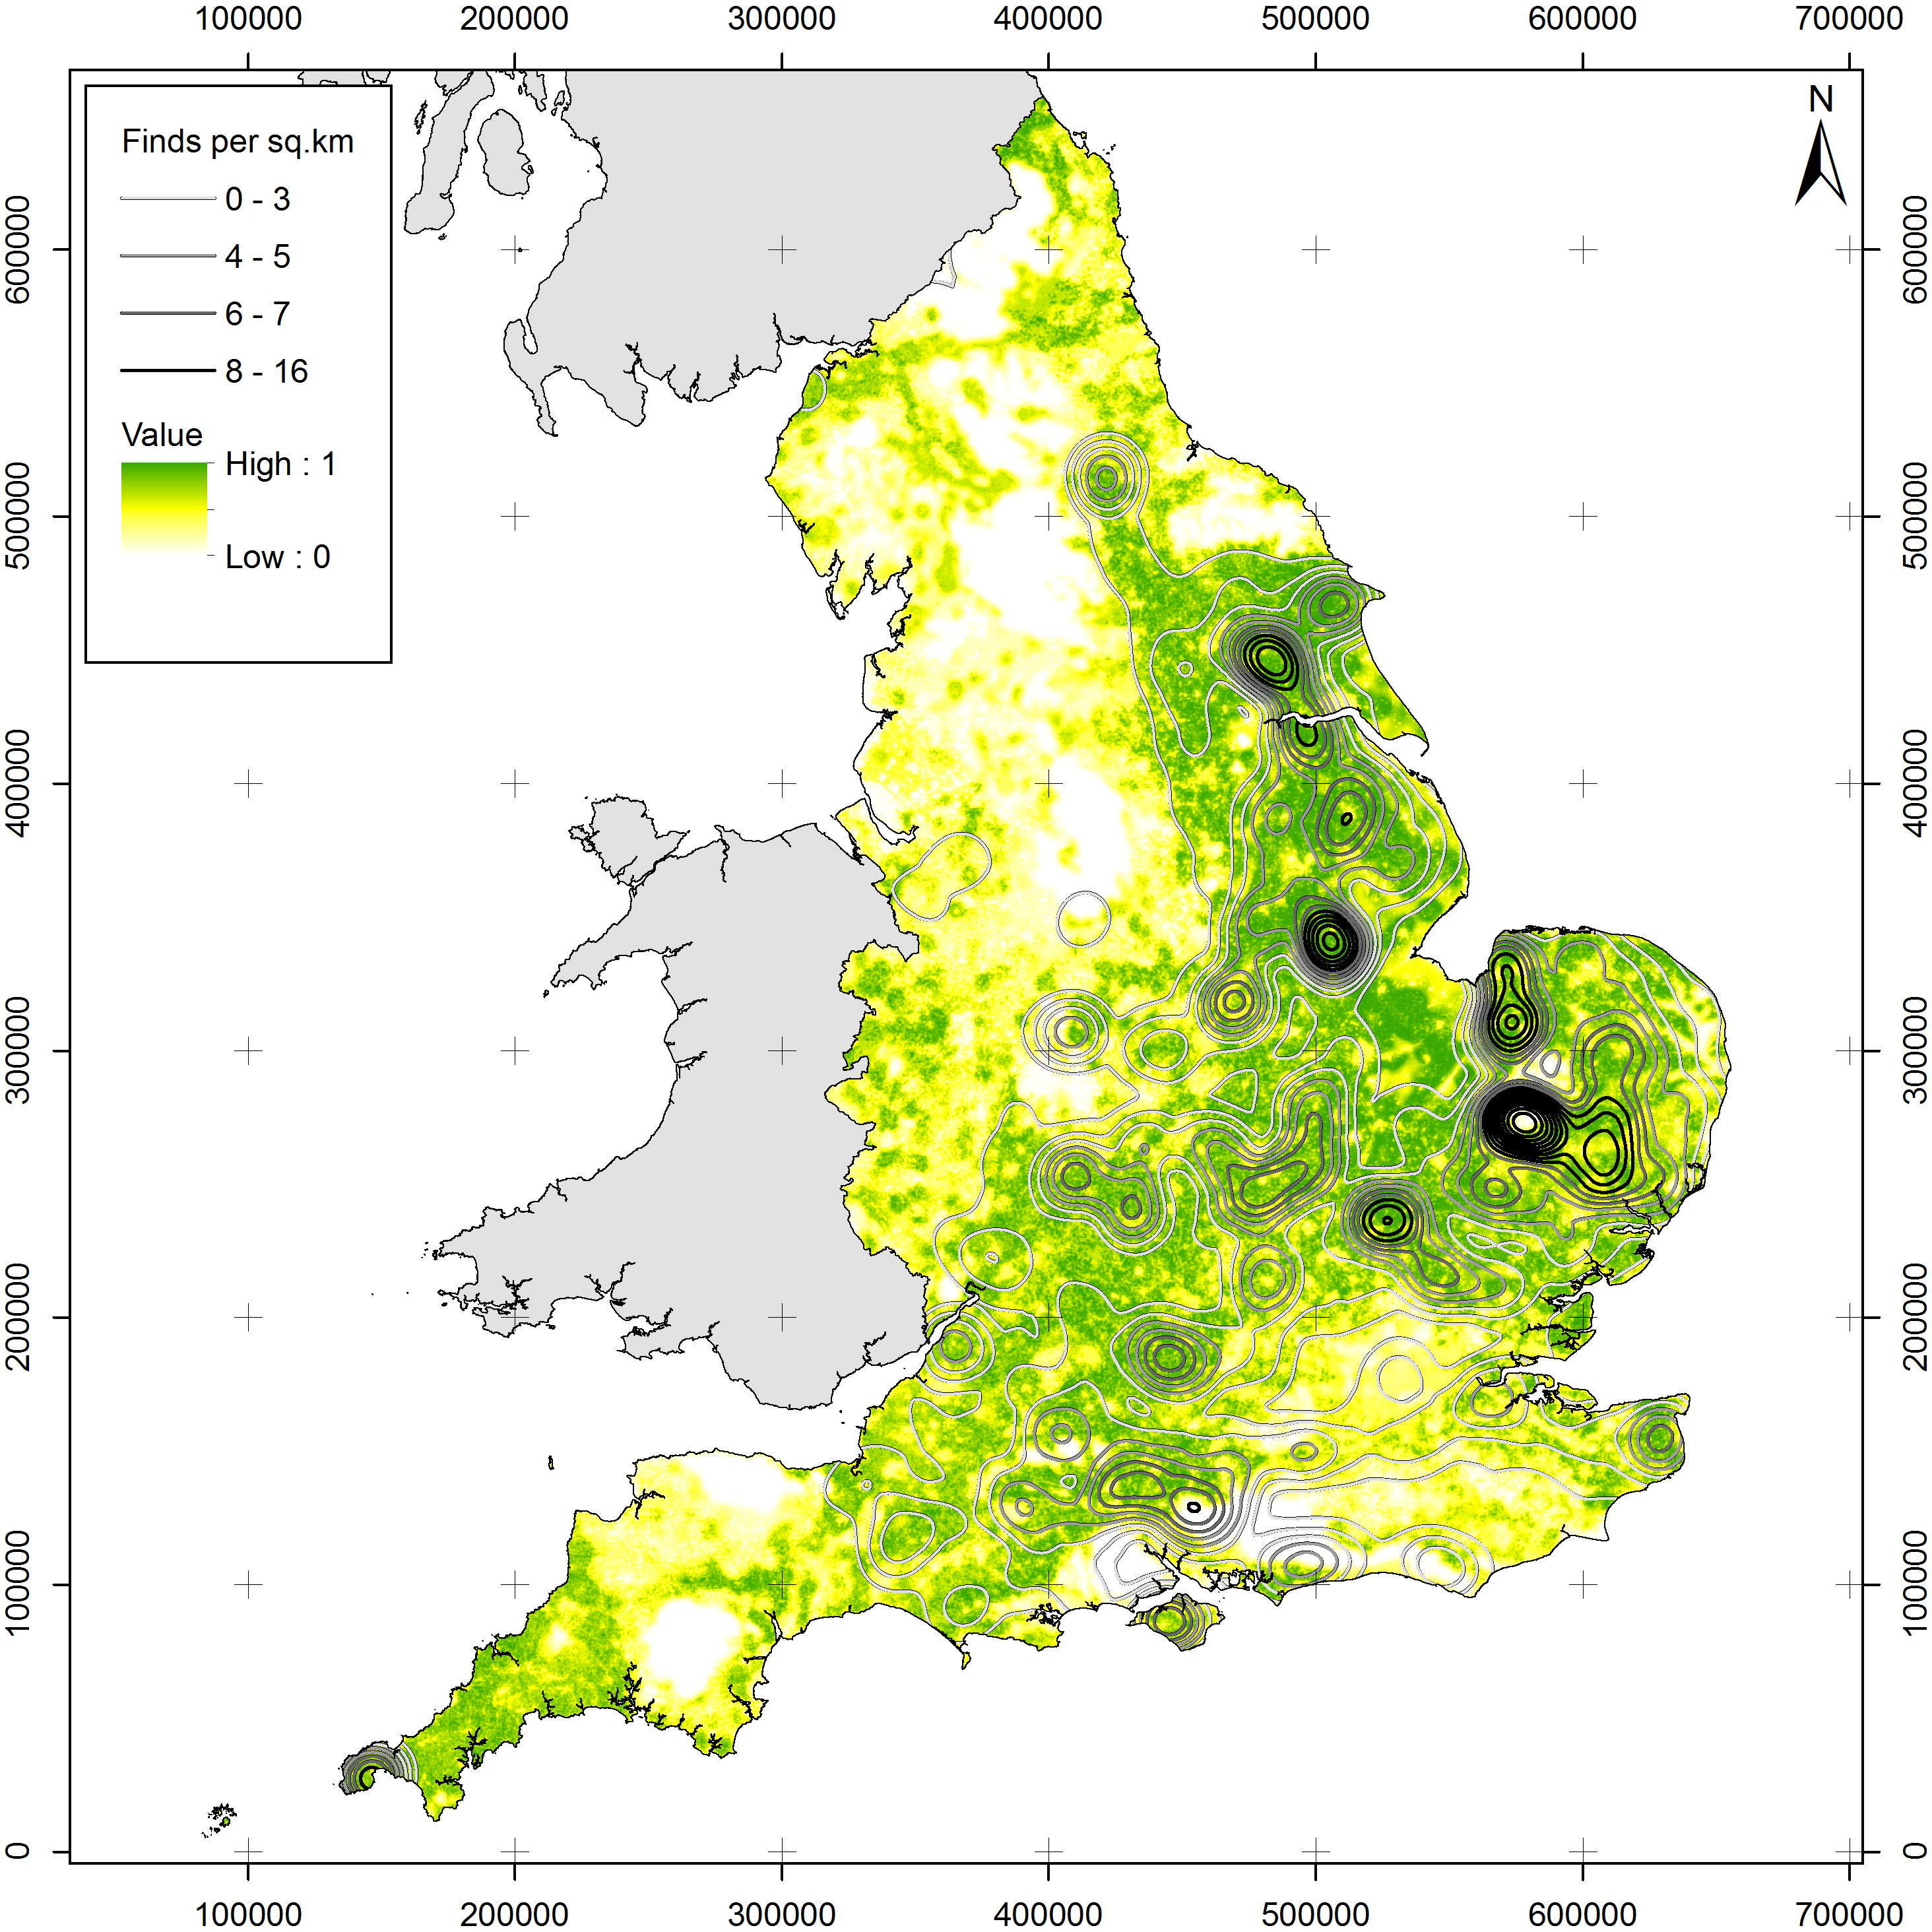
Perhaps unsurprisingly (given that the distribution of PAS finds was used in the definition of the affordance model), it is clear from these images that the highest densities of PAS records occur in areas of high PAS finds affordance. Importantly, however, there are some interesting exceptions to this pattern. At least one of these exceptions can be explained by the fact that prohibitive land-use assignations (in terms of metal detecting) came into force during the lifespan of the PAS (the South Downs became a National Park). Other discrepancies between the affordance model and the distribution of artefact records are, however, potentially interpretatively meaningful – in particular the extensive areas of relatively high affordance in the model that show no strong clustering in the PAS distribution in Cornwall and the Midlands. This may in part be explained by elements of affordance that we were not able to map (e.g. the popularity of metal detecting in different parts of the country). However, it seems certain that some of these discrepancies relate to genuine variations in past practice. Overall, we suggest that the process of comparing (visually and statistically) the distribution of artefacts within a given dataset with a combined affordance map created specifically for this dataset can act as a useful starting point for identifying the broad role played by key influencing factors (modern or otherwise) in artefact distributions at various spatial scales. Furthermore, if it became easier to model other affordance factors identified as having a significant effect on PAS distributions (e.g. variations in the density of metal detecting across England) it would be relatively simple to update the models to incorporate these.
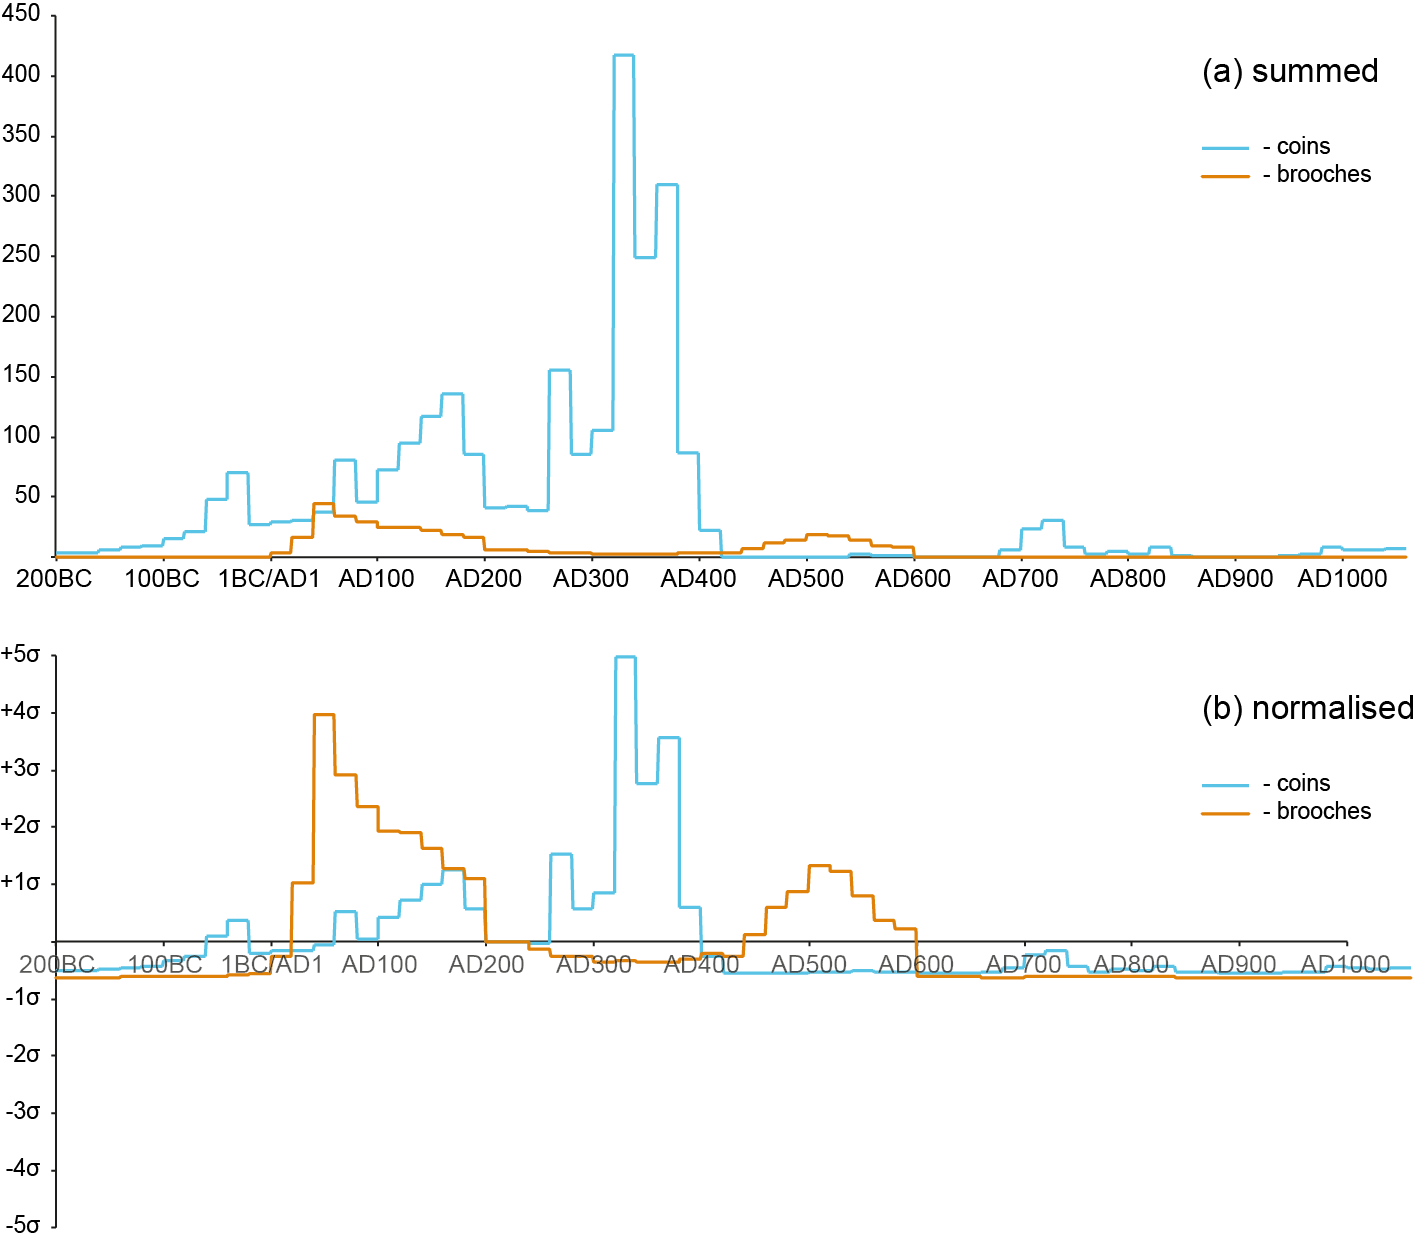
Another major concern of recent UK artefact studies has been to illuminate temporal patterning in the 'loss'/deposition of objects. Trends in coin (and to a more limited extent brooch) loss have been examined widely over extended time periods and at various spatial scales (for recent examples see Richards et al. 2009; Farley 2012; Walton 2012; Brindle 2014). Such studies typically assign clearly datable items (e.g. coins) to specialist-defined phases – coin (or brooch) periods based largely on production dates, e.g. Haselgrove (1993) for the later Iron Age, Reece (1991; 1995; 2002) for the Roman period, and Naylor (2004; 2007) for the early medieval period – in order to produce histograms of variations in coin loss through time (Figure 6). For the Roman and early medieval periods, patterns produced at a site or regional level have been compared to the expected coin loss patterning at a national level. The current national model of coin loss for the Roman period was defined by Walton (Walton's British Mean 2012, 36-7) and includes both PAS data and evidence from 367 excavated coin assemblages. Similar schemas for the early medieval period were devised by Blackburn (2003, see also Richards et al. 2009). These methods have allowed researchers to identify, interrogate and interpret deviations from expected patterning at a broader scale, and have given rise to persuasive accounts concerning the flow of metals and knowledge across certain regions of England (Farley 2012), and the chronology and character of activity both at a regional level and in particular landscape locations (Brindle 2014; Walton 2012).
Four key aspects of this work are relevant here. Firstly, such methods have been applied to a restricted set of evidence – only a narrow range of artefact types (mainly coins; see, however, Farley 2012), and only a small subset of material within these artefact types (closely dated items that can be slotted tidily into typochronological brackets), have been examined. For instance only 70% of Walton's dataset of 57,993 Roman coins recorded in the PAS database for England (as of 2008) were assignable to Reece's coin periods, and thus included in her analysis (2012, 19). Secondly, the time-spans covered by these studies typically fall within traditional period boundaries – again Farley's (2012) analysis of coin loss patterning across the late Iron Age to early Roman transition (from 80 BC–AD 180) is a rare exception. Thirdly, a considerable amount of work is involved in calculating national patterns of coin loss that include both excavated and other data. While this endeavour is very important and admirable (given the meticulous work involved), the resulting models are static and ultimately very difficult to update. Their accuracy for the point in time when they were created is compromised by the rapid rate at which they go out of date. This is especially true given the astonishing pace at which the PAS dataset grows, and at which evidence is produced via development-led fieldwork in the UK. Fourthly, these studies do, of course, demonstrate considerable critical awareness of some of the complexities involved in the models they employ. Key researchers have deliberated at length about the important issue that models which assign objects to typochronological periods based on production dates cannot account for the time period during which these objects were actually in circulation (see for example Blackburn 2003; Reece 1972, 1974; Lockyear 2012; Walton 2012, 27). Interestingly, however, researchers in this area have rarely engaged actively with wider studies addressing the temporal complexities of artefact data recovered from the ploughzone.
Alongside these trends in UK artefact studies a rather different quantitative mode of research into the temporality of artefact distributions has emerged. These studies arguably belong to a much longer and wider (international) tradition of critical artefact-based research that draws on evidence from extensive, often multi-period research-led field surveys (e.g. Flannery 1976; Haselgrove et al. 1985; Schofield 1991; Francovich et al. 2000). Within this research realm, the particular intricacies of interpreting temporal aspects of artefact evidence have been scrutinised much more closely (or at least in a different way). This includes considerations of the difficulties involved in assigning objects to relative typochronologies, the significant quantity of material that is excluded if only material that can easily be categorised is considered, and so on (e.g. Bevan et al. 2013a; Crema 2012; 2015; see Baxter and Cool 2016 for a rare discussion of similar issues in relation to Romano-British brooch distributions). On this basis, and drawing on the considerable computational skills of the researchers involved, recent studies in this area have focused on developing sophisticated digital models that address the 'elephant in the room' (Bevan et al. 2013b, 42) of 'temporal uncertainty' in finds analysis.
The fact that researchers working on UK artefact assemblages have engaged only very rarely with such approaches (see Green 2011; Baxter and Cool 2016 for notable exceptions) arguably relates to two main issues. Firstly, the digital models generated in these broader artefact studies rely explicitly on 'high quality' research data – those generated during detailed systematic landscape surveys (Crema 2015, 317). Secondly, significant computational skills are required to produce these models. It is certainly possible that such methods have seemed inappropriate or inaccessible to researchers dealing with artefact assemblages produced under less controlled conditions.
Our contention is that aspects of the models built using data from detailed landscape studies can be developed positively for investigating coarse-grained/large-scale artefact assemblages. In particular we will outline in more detail the interpretative potential of probabilistic 'aoristic' or 'fuzzy' methods. These were devised by Ratcliffe (2000; 2002), introduced to archaeology by Johnson (2004), and have been usefully refined and developed critically (e.g. Crema 2012; Bevan et al. 2013a) in recent considerations of temporal uncertainty (see Green 2011 for an extensive discussion and application of this method). In brief, rather than assigning artefacts to relative typochronological phases (e.g. the appropriate coin period or pottery phase), this approach considers the probability that the objects under consideration belong to one or more time-slices of equal (or less commonly unequal) length (e.g. 50 years) across a given study period (see Fuzziness script on Github). A very specifically dated item – a Roman coin with a limited period of production – would be given a probability of 1 of belonging to the time-slice AD 100–150. Meanwhile for more coarsely dated objects – a Middle Iron Age brooch assigned to the period 450–300 BC – the probability would be shared between the relevant 50-year time-slices (e.g. this brooch would have a probability of 0.33 of belonging to each of the time-slices 450–400 BC, 400–350 BC, etc.). By summing the temporal probabilities of all objects under consideration, a better understanding of broad depositional rhythms can be generated (see Garrow 2008, 31-2, for a similar approach applied manually to a relatively small database of Celtic art objects in Britain).
One important benefit of fuzzy temporal methods is that they can operate at multiple spatial scales – they can therefore transcend the spatial limits of specific typochronological schemes (e.g. regional brooch typologies). Another is that these methods are inclusive – both vaguely and precisely dated objects of the same type, and objects of different types (e.g. coins and brooches) can be considered together in one model. Additionally, and in contrast to models that require detailed specialist input and/or the integration of metal-detected and excavated evidence, such approaches can respond easily to shifts in a given artefact inventory or set of inventories – fresh models based on current evidence can be created simply by processing a new set of data. Basic applications of this approach have rightly been modified and critiqued for the purposes of analysing refined data from detailed systematic landscape surveys (for instance it is argued that the assignation of objects to artificial time-slices can introduce further temporal uncertainty, e.g. Crema 2012; 2015; Bevan et al. 2013a; 2013b). However, these issues are arguably much less important (and can aptly be set to one side) within the context of coarse-grained analysis, when the broader complexities of the data involved outweigh minor uncertainties introduced by the analytical method employed. Our intention is certainly not to undermine the considerable amount of detailed work that has gone into producing detailed typochronological phasing. Rather it is to suggest that in certain contexts – when we are seeking out broad patterning that extends beyond period-based and other specialist boundaries – it is helpful, at least as a starting point, to develop methods that operate beyond these specificities.
It is also worth highlighting the wider theoretical implications of employing fuzzy probability approaches. Various archaeological theories of time view the past as operating at different temporal scales, whether the simplistic threefold schema borrowed from Braudel and the Annales school (e.g. Bintliff 1991; Knapp 1992) or the more complex inter-related multiple temporal scales of non-linear dynamics (e.g. van der Leeuw and McGlade 1997). Through the application of fuzzy probabilistic modelling, the temporal resolution of time-slices can be adjusted to any width, meaning the study of the past at multiple temporal scales becomes much more straightforward (to calculate, at least). It is even possible to study multiple resolutions at the same time, by setting time-slices to non-standardised widths based upon the rate of change over time (Green 2011, 127–32), giving a sense of rhythm to the eternal continuity/change dichotomy. Since these models transcend conventional period boundaries, they also enable us to break down, at least to an extent, the period 'pockets' into which research too often falls, enabling a wider, more biographical view of the past (see Lucas 2005, chapter 4). In the remainder of this section we offer four brief explorations into the significant interpretative scope of fuzzy probabilistic methods using, as an example, evidence from the PAS dataset.
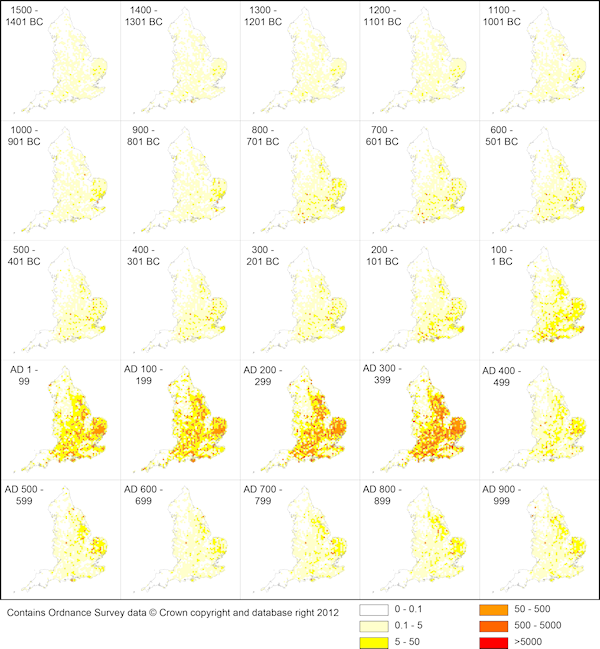
At a basic level a sense of the broad ebb and flow of object distributions across England from 1500 BC–AD 1086 can be gained by collating the summed probabilities by 100-year time-slices for all relevant PAS objects within spatial bins. Spatial binning is a method for grouping values from a given dataset within a predefined area or 'spatial bin' in order to elicit meaningful patterning (see Green 2013 for a further discussion of this method). In this case the spatial bins were tessellating hexagons where the distance from any vertex to its second nearest neighbour was 5km (Figure 7). It is important to note that this model necessarily smooths over any specific peaks and troughs in object deposition during periods in which items tend not to be closely dated (particularly in prehistory). Bearing this in mind, however, the resulting visualisation highlights strikingly the very gradual overall increase in artefact densities over later prehistory, the marked burgeoning of material for the Roman period, and the marked eastern focus of early medieval artefacts.
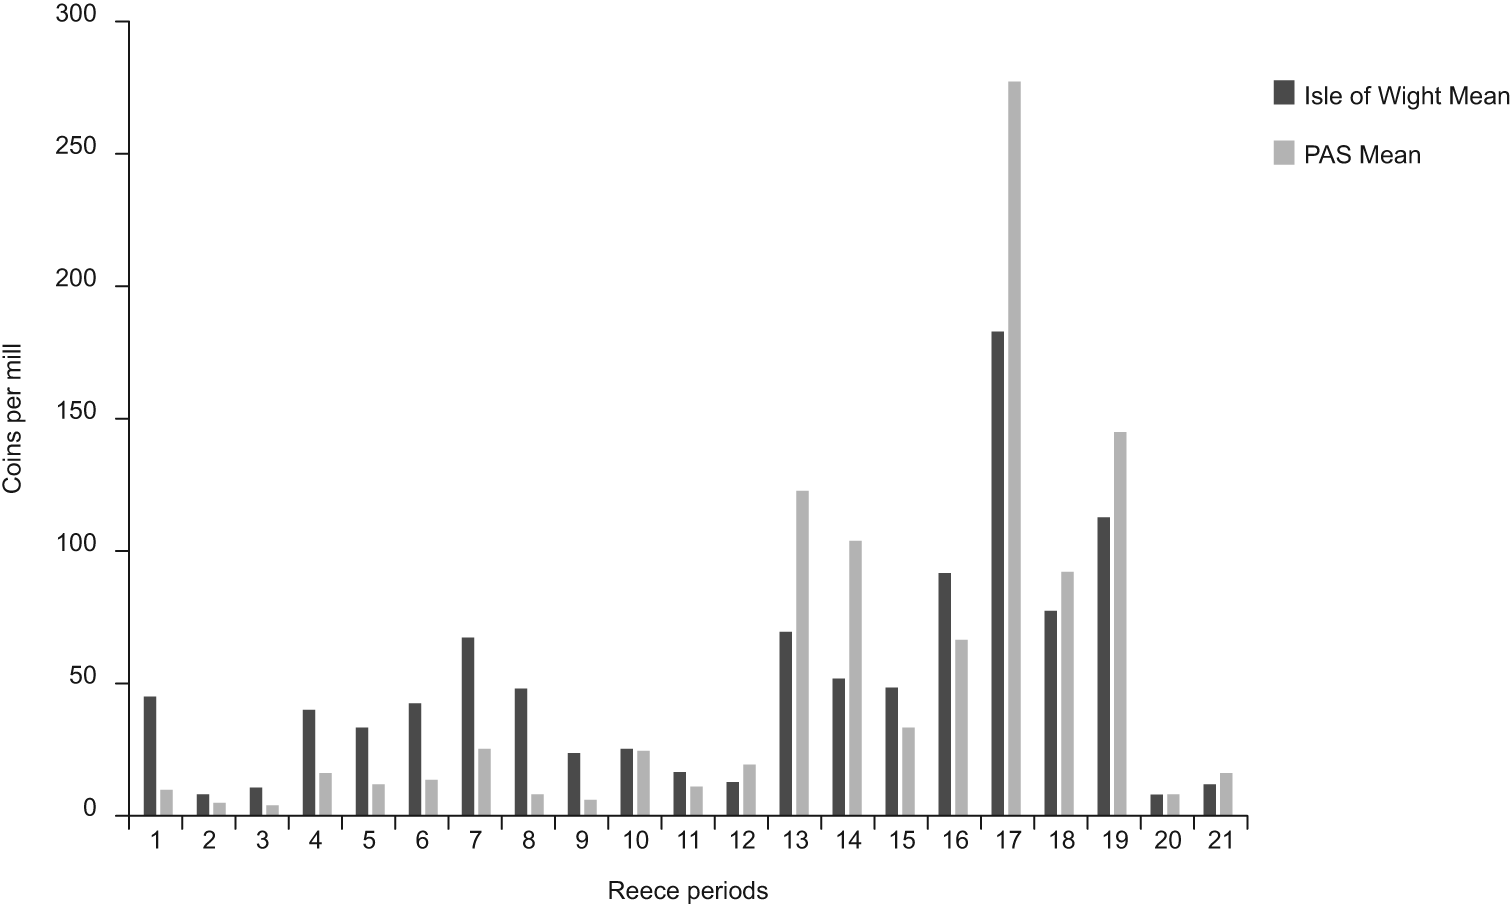
More specifically, the temporal patterning of coin deposition organised within specialist coin periods (e.g. Reece 2002) can be compared with that organised within 20-year time-slices using the 'fuzzy' probabilistic method. Looking at the results nationally (Figure 8a), one thing stands out: the greater numbers of finds being included using the probabilistic approach. Moreover, when looking at data for the Isle of Wight alone (Figure 8b), it immediately becomes apparent that focusing only on coins that fit neatly within specialist periods has resulted in a massive underestimation of activity across time. This is especially the case in the late Iron Age to early Roman transition period and in the late 3rd century AD. As such, it is clear that the fuzzy probability method used here produces a different – and in some ways more representative – account of past activity than approaches that structure the evidence within typochronological phases.
It is also interesting to compare the temporal patterning (using production dates) of coins deposited in hoards with that of coins found in relative isolation over the same period. For understandable reasons, coin hoards are usually excluded from coin loss models or are, at least, analysed separately to single coin finds (e.g. Bland 2013; Farley 2012, 196; de Jersey 2014; Walton 2012, 18). Hoards are undoubtedly complex in their temporal makeup (e.g. Lockyear 1993; 2007). Coin specialists also agree widely that coins found in hoards show different temporal patterns of loss to those identified as stray finds (see Blackburn 2003 for an earlier consideration of this issue). However, this separation bypasses the important issue that formal deposition (e.g. hoarding), accidental loss and discard are complementary aspects of past peoples' engagements with coins (and with artefacts more broadly, see also Millett 1994). It is also worth noting that the distinction between coins found in hoards and those found separately is not always clear-cut. Despite concerted recent efforts to remedy this issue (particularly where precious metals are concerned), hoards are not currently recorded systematically within the PAS database or more widely. For instance, objects from hoards are sometimes recorded as separate items rather than being grouped together as hoards, with no formal cross-referencing between the separate items. Additionally, some single coin finds could very well derive from ploughed-out hoards. The ongoing 'Crisis or continuity. Hoarding in the Iron Age and Roman Britain with special reference to the 3rd century AD project' (University of Leicester, UK) will no doubt cast further light on this and a range of other pertinent interpretative issues.

One interesting outcome of comparing the temporal profiles of coins found within 'hoards' and as 'single finds' using 20-year fuzzy probabilistic methods for the Isle of Wight (Figure 8c) is that the patterning for hoards alone is very similar to that for all coins (from single finds and hoards) when organised by 'fuzzy' time-slices (Figure 8b). Meanwhile the patterning for single finds alone echoes more closely that for all coins organised by traditional coin phases (as modelled by Walton 2012, 120). This certainly suggests that, on the Isle of Wight, hoards tend primarily to comprise either coins that cannot be attributed clearly to traditional coin periods, or collections of coins with various production dates (due to their poor temporal resolution they feature much more clearly in models of overall coin loss organised by 'fuzzy' time-slices than they do in models organised by traditional coin phases) – an interesting finding in its own right.
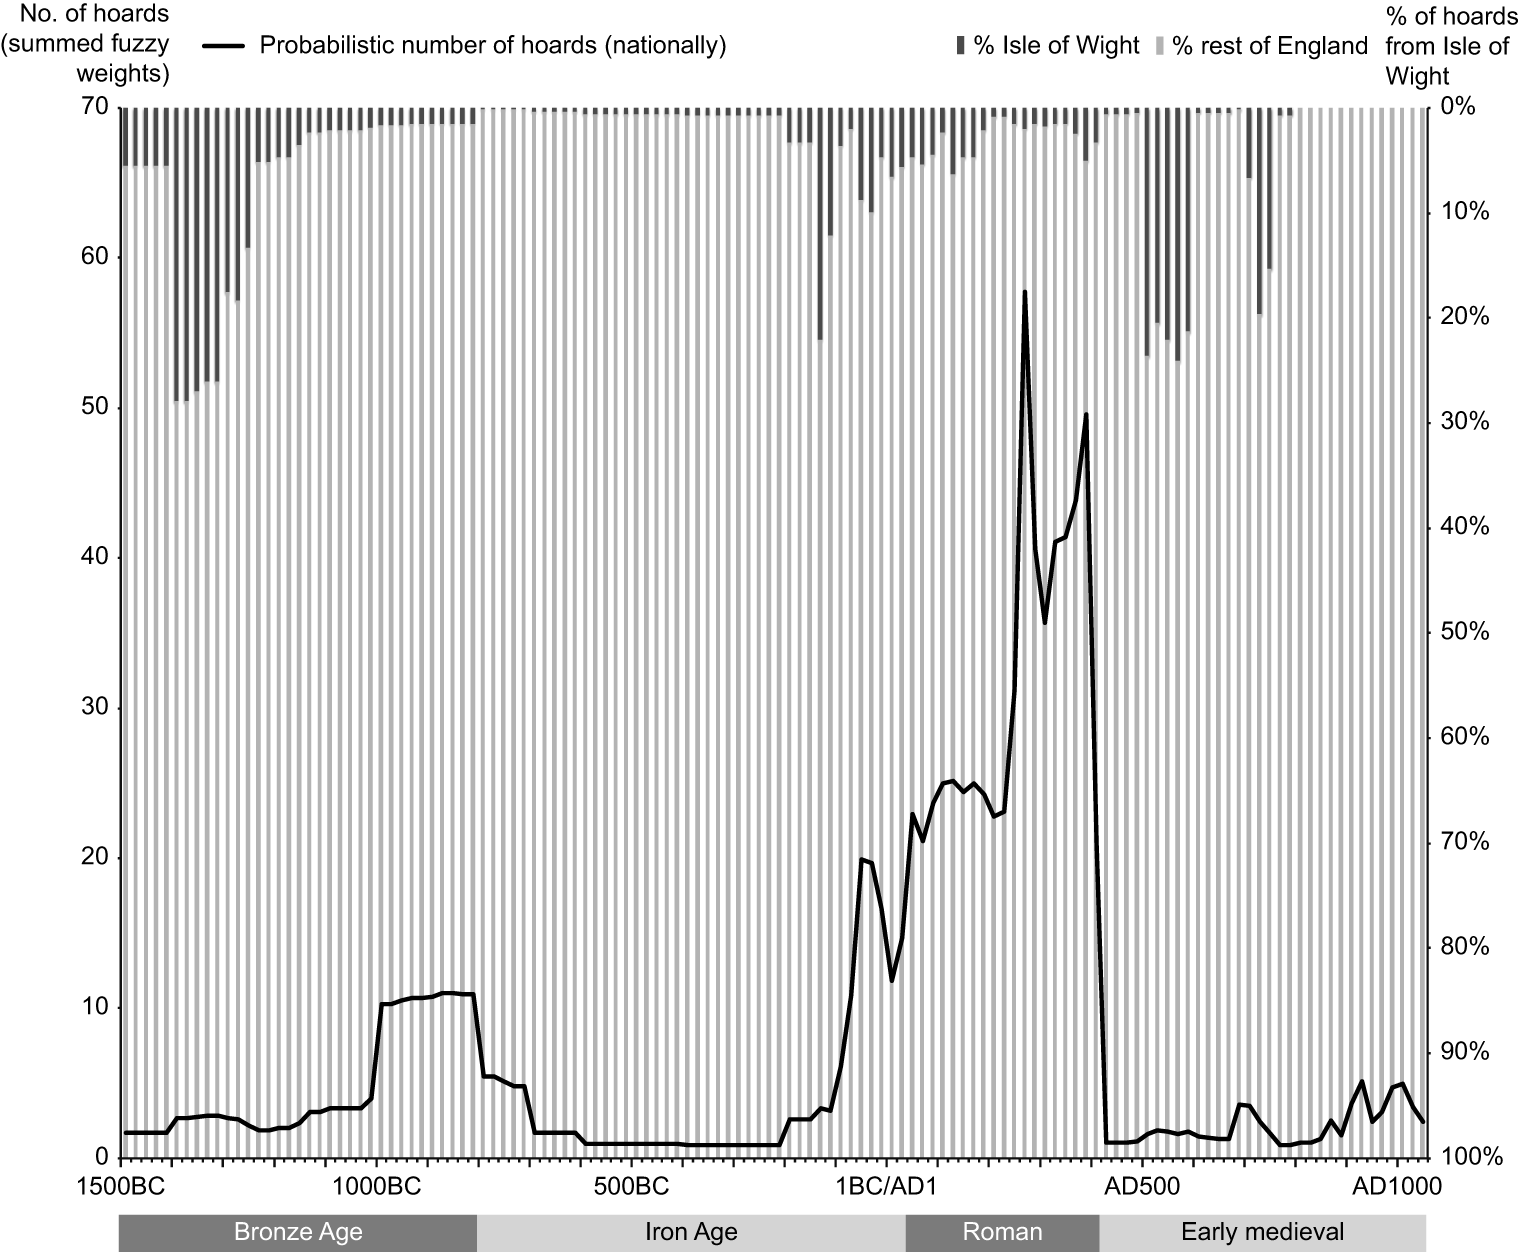
Focusing on the tempo of hoarding practices more widely, levels of hoarding within one specific region (the Isle of Wight) can be viewed as a percentage of that at a national level (Figure 9). This visualisation shows clearly that, across England, hoarding practices were most prevalent at the turn of the first millennium BC and during the Roman period, with a particular peak in activity in the later 3rd and 4th centuries AD (see also Bradley 1990; 2007; Bland 2013). Since the Isle of Wight represents only c. 0.5% of England by area it is worth noting that the island's hoarding evidence makes up a higher than expected proportion of all English hoards for much of the period 1500 BC–AD 1086. This is particularly the case for the periods from 1400–1500 BC and in three shorter bursts between 200 BC–AD 750 – in the early 2nd century BC, and in the late 6th and early 8th centuries AD. This image therefore highlights convincingly and importantly how regional patterns in the tempo of certain depositional practices (hoarding) can deviate significantly from wider patterning.
By modelling both coin and brooch loss on the Isle of Wight using 20-year fuzzy time-slices, the value of considering together temporal patterning in the deposition/loss of different object types becomes clear (Figure 10). Several recent artefact studies (e.g. Brindle 2014, 124; Farley 2012, chapter 5) have recognised rightly that while coin evidence is attractive for its close temporal resolution, it can offer only limited insight into the broader character of past activity. Farley did compare briefly coin and brooch loss within separate artefact concentration zones in the East Midlands (2012, 336). However, she did not enumerate this comparison or consider in detail the patterning beyond separate sites. This omission probably relates to the fact that if traditional coin and brooch periods are used (as was the case in Farley's analysis), the brooch loss profile is barely visible within the histogram, owing to the low number of brooches involved (relative to coins) and to vagaries surrounding the dating of brooches, particularly for the Iron Age period. Modelled using the fuzzy probabilistic method for the Isle of Wight, the very different tempos of coin and brooch deposition on this island are brought into view much more clearly.
Overall, we argue, there is definitely significant potential for pursuing further the use of probabilistic models for examining basic long-term patterning in object deposition. In particular, the capacity of such models to compare patterning in different artefact sets (coins, pottery, brooches, and so on) and at different spatial scales could be extremely fruitful. It is also worth mentioning that these models might be enhanced significantly in future with the development of more refined measures for handling the tricky issue of how object production dates relate to periods of circulation and episodes of deposition. For instance, specific modifications could be made that take into account the variable circulation of certain sets of material (e.g. Claudian coins) in different parts of England as well as the diverse circulation periods of different coin issues (see Creighton 2014 for an important step in this direction).
The issues of, firstly, how (if at all) to define meaningful concentrations of material or 'sites' and, secondly, how to interpret any such clusters identified, have, once again, been central to landscape-scale artefact studies at an international level for many years (e.g. Foley 1981; Gallant 1986; Millett 1991; Dunnell 1992; Bintliff 2000a; Warren and Asch 2000; Bevan and Conolly 2009; Verhagen and Whitley 2012; Markofsky and Bevan 2012; see also papers in Haselgrove et al. 1985; Schofield 1991; Francovich et al. 2000). These issues have been important within recent UK artefact studies for two main reasons. They offer a tactic for targeting subsets of material within substantial artefact assemblages for further investigation, and for approaching bodies of evidence analytically that are otherwise quite difficult to interpret. For instance, once site types – 'rural', 'military', 'ritual', 'market', etc. – are assigned to concentrations of material according to the range of items they include, these clusters can be analysed and mapped alongside other known archaeological sites (see Cool and Baxter 1995; Cool 2002; Eckardt 2005, for approaches to characterising sites based on finds from excavated sites). Approaches that identify and interpret 'sites', 'activity areas' (Daubney 2015, 49), or 'concentration zones' (Farley 2012, 319) are a feature of UK artefact studies spanning the Iron Age to early medieval periods and examining a wide range of object types. Within the early medieval period specifically, the term 'productive site' was introduced to describe 'sites found by metal-detecting, and from which larger amounts of metal artefacts and/or coinage have been discovered than is normally expected in the local area' (Richards et al. 2009; see also papers in Pestell and Ulmschneider 2003).
Two main aspects of this work are noteworthy here. Firstly, with two key exceptions (Brindle 2014; Daubney 2015) few (if any) recent UK artefact studies have engaged explicitly with wider discussions about the complexities involved in defining and interpreting concentrations of material within archaeological surface scatters (see above). Secondly, and almost certainly in relation to this last point, the criteria used to define 'sites' have been highly variable – an attribute that arguably undermines the broader relevance of these analyses (Table 3). Of course it is important to generate locally (and temporally specific) meaningful understandings of what constitutes a significant concentration of material. However, it is just as important to develop systems for comparing these 'sites' more broadly.
| Criteria used to define 'sites' | Study area | Period/artefact type of relevance | Source |
|---|---|---|---|
| 'Concentration zones' of >100 finds within neighbouring 1x1km grid squares | East Midlands | Late Iron Age and Roman | Farley (2012, 319) |
| 'Parish assemblage' of >/= 5 coins | England | Iron Age coins | Leins (2012, 216) |
| >/= 5 coins within 200m of each other | Isle of Wight | Late Iron Age and Roman | Walton (2012, 26) |
| >/= 2 finds within 200m of each other | Cumbria | Late Iron Age and Roman | Brindle (2014, 24) |
| >/= 5 finds within 200m of each other | Northamptonshire, Warwickshire, Wiltshire, Worcestershire | Late Iron Age and Roman | Brindle (2014, 24) |
| ADABS – Abnormal Densities Above Background Scatter (upper octile of site densities for a given area) | Mediterranean | Roman ceramics | Millett (1991, 23) |
| 10 or more coins at a given location | Lincolnshire | Early medieval | Ulmschneider (2000, 31, map 5) |
| 6 or more coins at a given location | Hampshire/the Isle of Wight | Early medieval | Ulmschneider (2000, 51, map 21) |
| 4 or more coins at a given location | Norfolk and Suffolk | Early medieval | Hutcheson (2006, 84) |
| 5-9 finds at a given location = 'probable site'; 10-24 finds = 'strong site'; >24 finds = 'very strong site' (no area specified) | Norfolk | Early Anglo-Saxon | Chester-Kadwell (2009, 91) |
| >/= 20 finds within one parish | England | Early medieval | Richards et al. 2009 |
The method developed here builds mainly on Brindle's (2014) thoughtful approach to the identification of Roman activity sites using PAS evidence, and on Millett's (1991) statistical model for identifying sites within artefact distributions from detailed landscape surveys. Along with Richards et al. (2009), Walton (2012) and earlier studies that developed methods for identifying 'sites' (see above, in particular Millett 1991; Bintliff 2000a), Brindle stressed the importance of considering the relationship between concentrations of material that can be seen to constitute meaningful 'sites' and much wider 'background' densities of material (2014, 24). Unlike most other UK researchers, Brindle (2014, chapter 3) also adjusted the criteria he used to define 'sites' in different places based on this understanding (see also Ulmschneider 2000). In areas where overall finds densities were low (e.g. in north-west England), very small assemblages (e.g. 2 items within a distance of 200m) were considered potentially to be significant. Meanwhile in areas where overall object densities were higher (e.g. south-east England), a higher concentration of material was required in order for a potential activity site to be identified (5 items within a distance of 200m).
Like Brindle (2014, 15), we suggest that it is important to rethink the issues involved in identifying 'sites' when working with large artefact inventories that cover extensive areas (e.g. England and Wales) and comprise mainly metal objects collected with varying amounts of precision. The subtleties of overall artefact distributions are not visible or necessarily meaningful at a national level. While Daubney (2015, 22–4) raised some important points in explaining his focus on 'activity areas' and 'persistent places' (with the latter operating essentially as multi-period – repeatedly revisited – versions of the former) rather than on 'sites', we are comfortable here in sticking with the term site. Site is perhaps less problematic as a concept if it is used abstractly to describe concentrations of archaeological material that potentially offer a perspective on certain kinds of past practices, rather than as readily understood or fixed entities (e.g. Verhagen and Whitley 2012, 54-5). Additionally, it is worth noting that Daubney's method for identifying 'persistent places' would simply not be viable in areas with very low levels of material such as Cumbria.
More broadly, it is obviously very important that the interpretative process does not end at identifying sites, assigning them to accepted site types (or even devising new ones), and marking them as dots, polygons or densities on maps. There is certainly significant scope for improving our understanding of the character of past practices represented only by artefact assemblages, whether or not this material has been generated within a controlled research environment. It is also vital that more interesting and dynamic ways of weaving evidence from object concentrations into our broader archaeological accounts are developed (see, for example, papers in Conneller and Warren 2006 relating to a period – the Mesolithic – in which a large part of the evidence base is made up only of artefact scatters). Following McFadyen (2006), we suggest that object concentrations can be approached productively as a form of 'architecture' in their own right. Viewed in this way, they can be understood not as neat, classifiable entities but as starting points for tracing movements of and connections between past people and materials that extend well beyond any individual site (see Bintliff 2000b for an earlier discussion of this issue in pursuing a rather different interpretative agenda).
Our own method for defining sites uses variation in the density of artefacts logged in the PAS database at a national level, to determine what constitutes a meaningful concentration of material locally. It also takes into account, firstly, variation in artefact affordance across England (see above) and, secondly, variation in the density of material through time – clearly a cluster of ten objects of later Bronze Age date has a different meaning from a similar grouping of Roman objects, since material culture is scarcer overall in the Bronze Age. The mathematical processes used to generate these models are outlined in detail in Appendix 1, and are summarised briefly here.

The initial step was to compare artefact densities at a local (fine-grained) and regional (medium-grained) level using KDE surfaces. The precision of location for the individual findspots makes little difference to the regional level model, but can have a significant effect on the local level model: this was not corrected for in the experimental models produced herein, but should be dealt with in any formal application by discounting those records below a certain level of spatial precision before processing (in the local model). The regional level model was also modified using the national affordance model (see above), in order to account for the potential to discover finds. Differences between local and regional level artefact density models were then calibrated so that local 'peaks' within areas of high regional density were retained (e.g. a very substantial cluster of coins on the Isle of Wight), and local peaks within areas of low regional density were amplified (e.g. greater significance would be given to two nearby brooch finds in north-west England) (Figure 11).
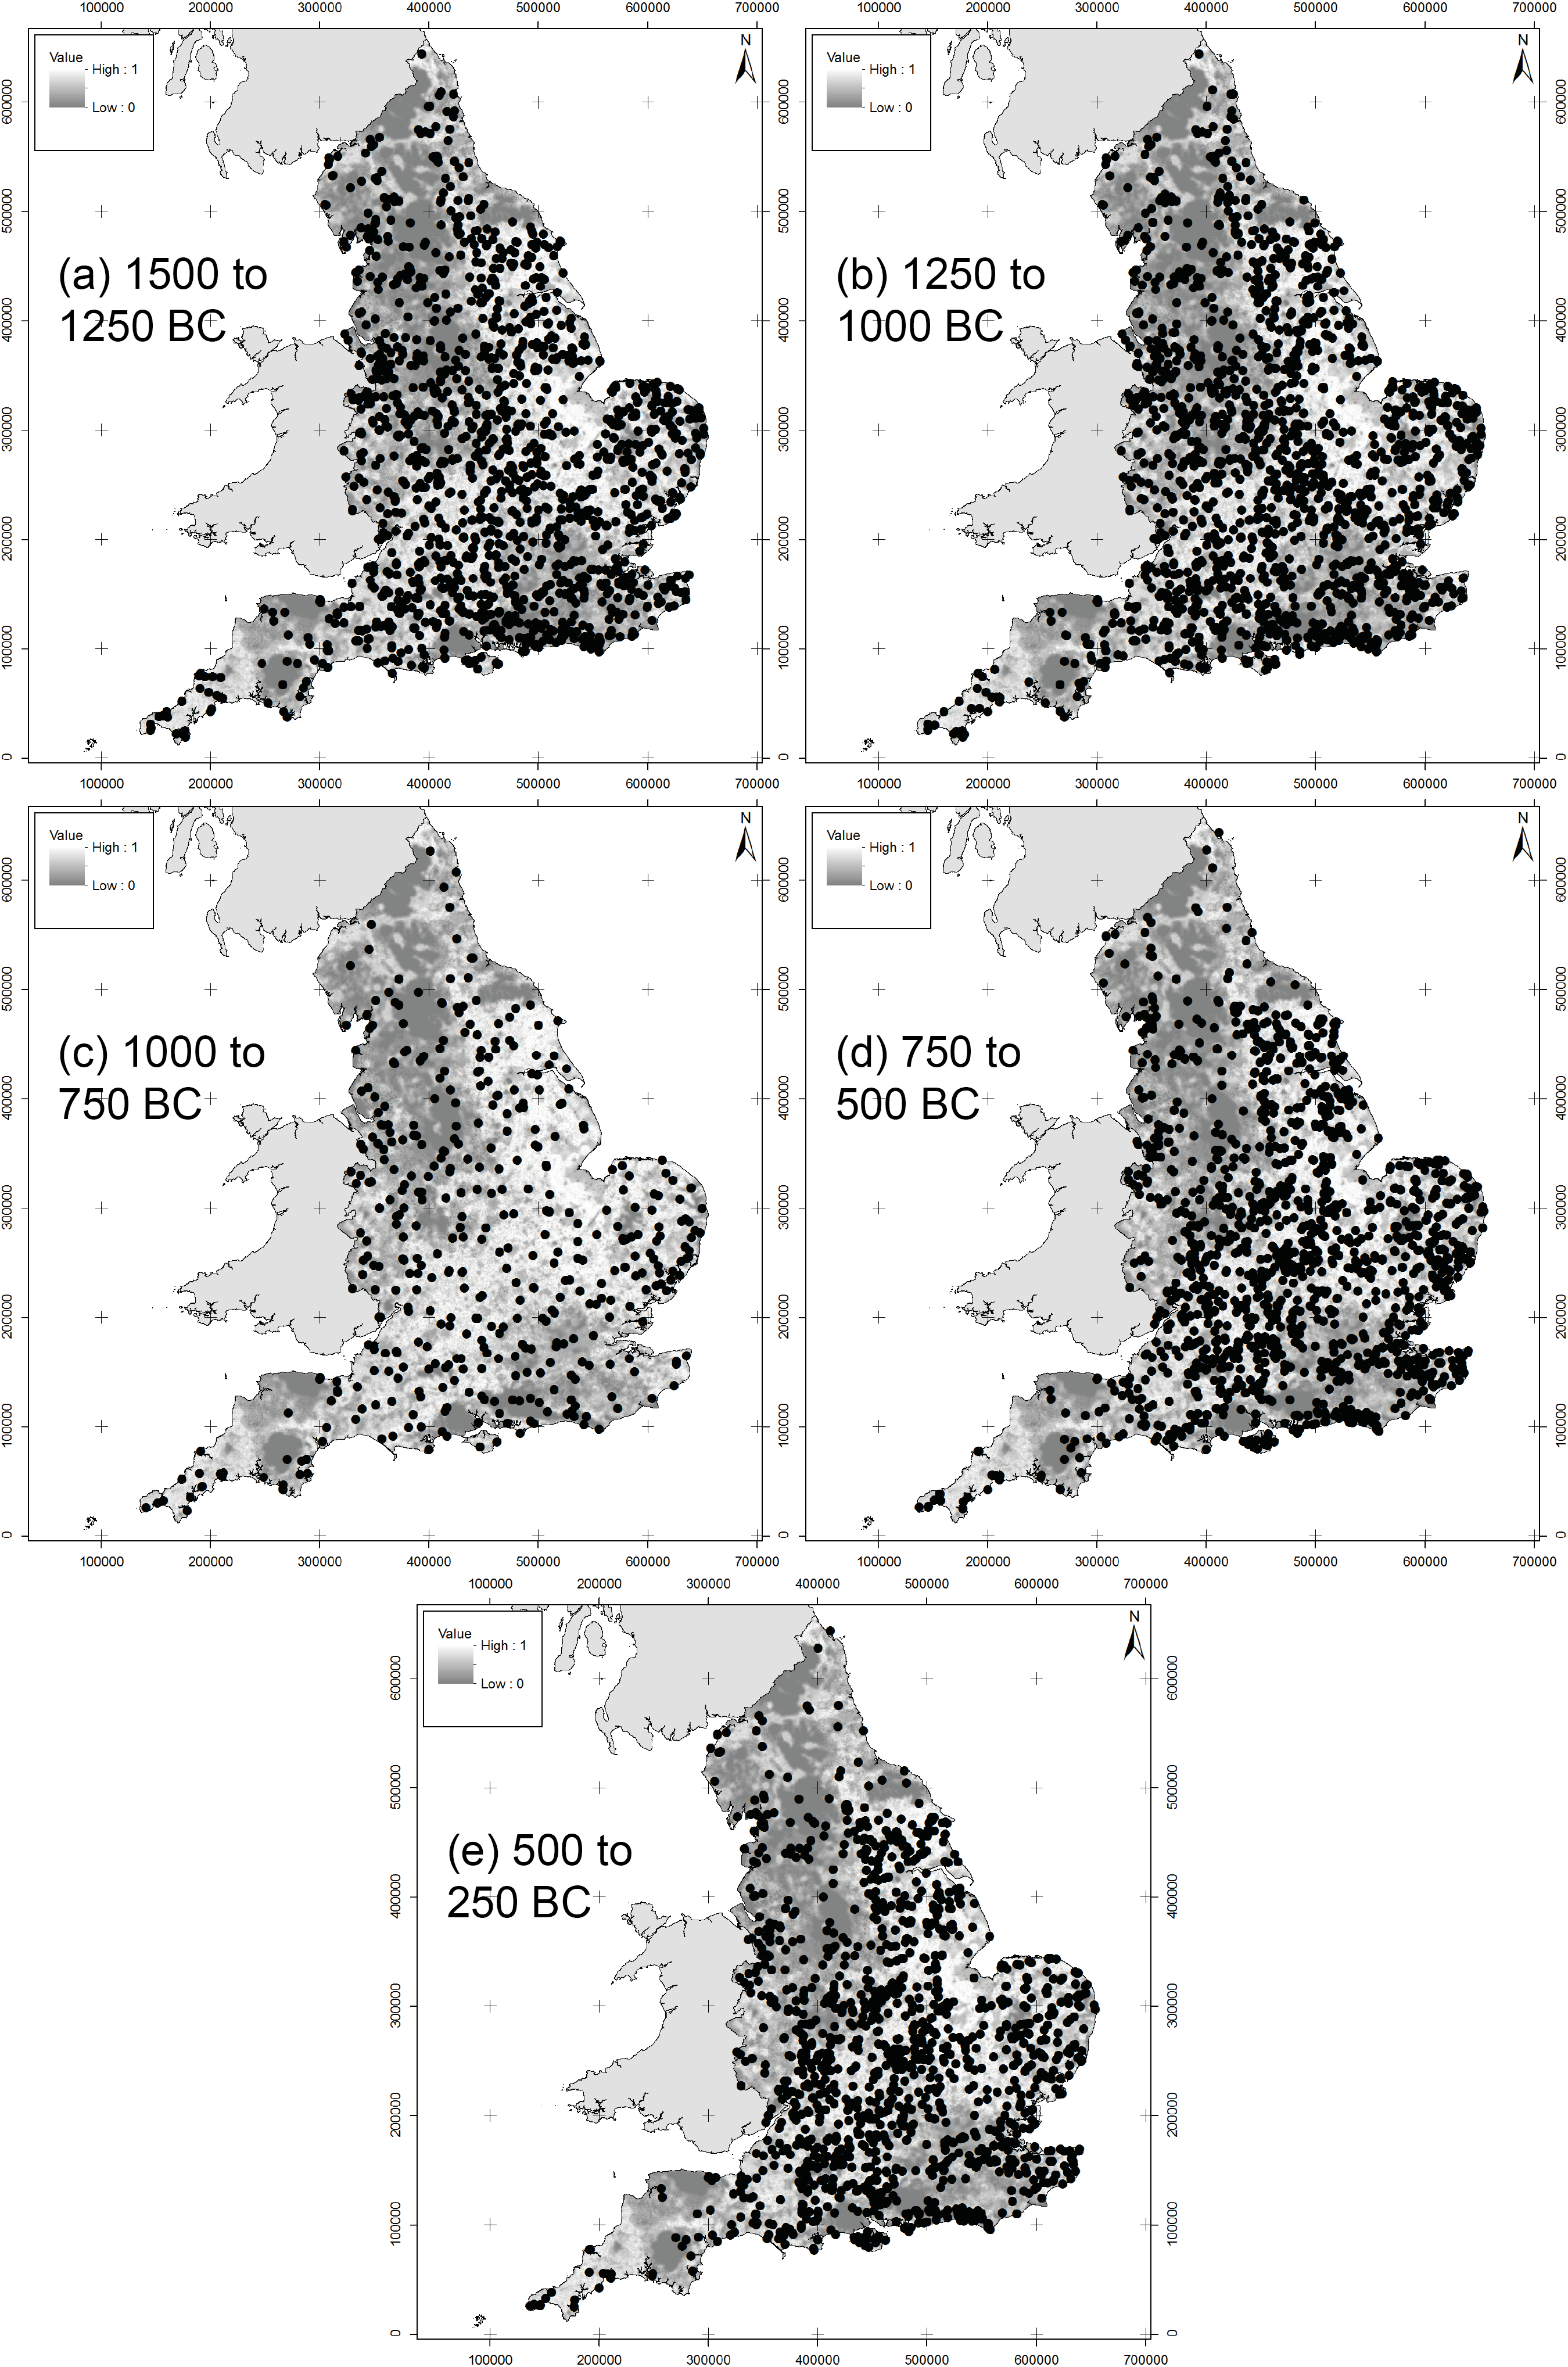
The next step involved using a fuzzy temporal approach (see above) to account for the variable occurrence of material over time. Ten separate artefact density models were created representing 250-year time-slices covering the period 1500 BC–AD 1086. Potentially meaningful concentrations of material were identified by splitting the range of values for each time-slice into octiles (eight numerically equal parts). Following Millett's (1991) method for identifying Abnormal Densities Above Background Scatters (ADABS), values in the uppermost octile (the top 12.5% of values) were identified as sites (Figure 12). 'Sites' that occurred on the intersections between Ordnance Survey kilometre grid squares or on parish centroids could be filtered out (or marked as weak candidates) at this stage to reflect the increased likelihood of them being false positives caused by imprecise coordinates in the source data.
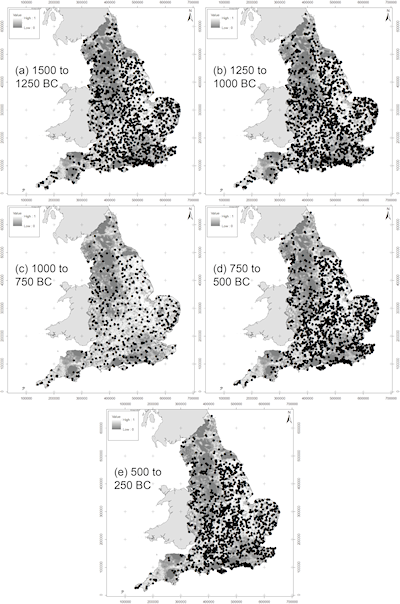
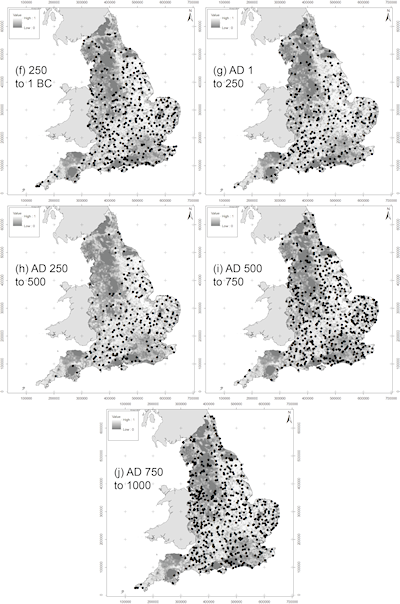
One interesting outcome of these models is that higher densities of sites are identified in the prehistoric (and to a lesser extent the early medieval) time-slices (maps (a)–(e) and (i)–(j) in Figure 12) than in the Roman time-slices. This could suggest that the model needs further adjustment – it is possible that relatively small concentrations of material within periods that have a lower density of material overall have been overemphasised in the existing model. However, it is certainly possible that during these periods – particularly in prehistory when people are likely to have still lived relatively mobile lifestyles (e.g. Giles 2012, 47) – concentrations of activity are more often represented archaeologically by surface scatters of material (see Evans et al. 2013 for a further discussion of this issue). Another outcome is that the overall distribution of sites across England is fairly even. Importantly, this offers an opportunity to consider in more detail the character of activity in areas that are typically under-represented in broad-scale analyses (e.g. north-west England).
It is also useful to compare the location of artefact-based sites identified within these models, with known archaeological sites logged within composite regional and national level databases (HERs and the NRHE). If the evidence is organised using broad periods (rather than fuzzy time-slices), most of the artefact clusters identified as sites in the models were over 200m from an existing HER/NRHE record of the same period (not including findspots), suggesting that they were not known previously (90% for the later Bronze Age; 84% for the Iron Age; 64% for the Roman period; 87% for the early medieval period). It is also worth noting that, in line with the definitions for sites given in Table 3, a value for the density of finds required in order to identify a potentially significant site within any given study area can easily be extracted from the local density models outlined above.
Overall, the models presented here for defining meaningful concentrations of material are clearly open to further refinement and testing, for instance by undertaking further fieldwork (e.g. Brindle 2014). However, the initial results are certainly promising. These models offer for the first time a national-level measure for identifying sites that are potentially worth investigating further or protecting (e.g. Boldrini 2006). Since they are not dependent on current administrative boundaries (county boundaries, government administration areas, etc.) – the models can potentially facilitate studies that operate at a range of spatial scales and beyond standard geographical units. These models are also nuanced (they take into account affordance factors, and spatial and temporal variations), and easily adaptable – shifts in the contributing data can easily be accommodated and the findings can be presented in various different ways (as maps, density values, etc.). Perhaps most importantly, the approach taken here places existing (variously generated) criteria for identifying sites in context – it would certainly be worthwhile comparing in more detail previous site definitions (Table 3) and those generated through the models presented above. These models therefore offer a unique opportunity to connect and compare considerations of sites defined by surface artefact scatters from different regions and time periods.
This article adds substantially to recent discussions about archaeology's ongoing 'data deluge' (Bevan 2015). It does so from the perspective of a research project (EngLaId) that has broken new ground in its attempt to integrate and also to interpret on an unprecedented scale existing digital datasets produced in varied working contexts and sometimes over considerable time periods. One important step has been to emphasise the potential for interpreting large complex datasets as well as attending to their complex makeup. Our attempt to broach fundamental archaeological questions – issues surrounding time and space – using composite UK artefact datasets marks a significant interpretative shift from previous work in this vein. Secondly, we have developed methods for approaching large complex datasets that bring together data and ideas from typically separate research areas and which work at multiple temporal and spatial scales. In doing so, we hope to have raised new social and theoretical concerns.
Our consideration of the interpretative potential of one specific set of substantial composite datasets – UK artefact inventories, in particular the PAS database – has yielded important computational methods that address key current themes in UK artefact studies while also resonating with recent developments in artefact research, and in archaeology more broadly. We have raised the importance of considering in tandem different factors that shape the creation of artefact distributions and of treating these as contributing positively to the interpretative process. The interpretative benefits (in terms of spatial and temporal scope and also of integrating patterning relating to different artefact types) of working beyond traditional specialist-defined typochronological periods in seeking to understand temporal aspects of artefact assemblages have also been explored. Finally, we have argued that in certain contexts (e.g. when seeking to identify subsets of evidence for more detailed analysis within very large bodies of data) it is relevant and indeed important to develop systematic and nuanced ways of identifying potentially meaningful concentrations of material (or 'sites') within extensive artefact distributions. As well as being directly pertinent to UK artefact studies, the themes addressed – how to understand long-term/broad-scale archaeological patterning; how to make use of the widest possible array of evidence available to us; how to link interpretations generated at different analytical scales; how to work across traditional research boundaries – are clearly relevant much more broadly.
The study also contributes to discussions about how to interpret (as well as to gather) substantial existing datasets in archaeology (see also Allison 2008; Spielmann and Kintigh 2011; Bradbury et al. 2016). In particular, we have highlighted the important role that computational models can play not only in exploring analytically large digital datasets (see also Bevan 2012), but also in extending and even reconfiguring specific research themes developed through more traditional research means. The creation of such models does sometimes require specific computational skills – they are not always easily accessible to all researchers. In the context of archaeology's burgeoning assemblage of digital data, however, it seems vital that archaeologists at a wide level remain open to the growing analytical potential of these approaches, and seek actively to build them into broader interpretative accounts. Only by building strong relationships between detailed specialists studies and explorations at a coarse-grained and broad-scale level will it be possible to develop productive and dynamic understandings of archaeological phenomena that operate at multiple temporal and spatial scales.
One, perhaps surprising, outcome of this investigation is the extent to which it has been necessary to revisit ideas and methods developed some time ago in artefact studies (together with appraisals of these methods) and to re-evaluate their relevance in the context of working with substantial composite digital datasets. While such critiques have necessarily and importantly refined the analysis of artefact evidence produced during research projects, we argue that they do not necessarily apply in the context of dealing with evidence that has been produced well beyond such controlled, cohesive contexts. This is not to advise that researchers should rest their critical faculties when handling large complex datasets. Rather, in such contexts we suggest critical attention might more productively be placed elsewhere – for instance in building models that are sensitive to the particular character of the data involved and to the insights of researchers in multiple related fields (artefact specialists, digital specialists, etc.). Overall, we suggest, large complex datasets require us to be creative in our interpretative practices – they encourage us not only to ask questions at a different (larger, coarser, longer-term) scale, but also to think in different (perhaps more socially aware and open-minded) ways.
Finally, we would like to stress the necessarily emergent character of our analytical outcomes. The models presented here were developed specifically in order to connect with key current themes in UK artefact analysis. It is very much hoped that they will be challenged, modified and enhanced by researchers in this area and, more importantly, that they will spark new attempts to explore central archaeological questions using large complex digital datasets much more broadly.
The 'sites' methodology can be summarised mathematically as follows (where: PAS_200 = 200m KDE of PAS data; PAS_20000 = 20km KDE of PAS data; AFF = affordance model; MODEL = output; max(n) = maximum value of n):
A = PAS_200
B = PAS_20000 x ((AFF ÷ 2) + 0.5)
MODEL = (A ÷ max(A)) ÷ (B ÷ max(B))
Owing to the 200m area of interest defined by previous researchers (Table 3), a KDE surface with a 200m kernel was used as our input model of 'local' variation, although this may be too small in any practical application of the method unless records have been rigorously sorted to keep only those with reasonably precise coordinates. 'Regional' variation was defined using a KDE surface with a kernel of 100 times the size (i.e. 20km). This 'regional' model was then modified by multiplying it by the affordance layer, the latter modified so that it varied from 0.5 to 1 (rather than 0 to 1): this was done to lessen the influence of the affordance model on the final result, due to its various imperfections (see above). The 'local' and 'regional' models were then normalised by dividing by their respective maximum values, so that they varied between 0 and 1. The final model was then created by dividing the 'local' model by the 'regional' model:
In ArcMap: use the Kernel Density tool to create KDE surfaces. Copy the maximum values for each surface manually from the Statistics in the Source tab of the Layer Properties dialogue. All other steps can be undertaken using the Raster Calculator.
This has the effect of retaining local peaks in areas of high regional density, while increasing local peaks in areas of low regional density (Figure 12 (a-e and f-j)). In this, the method devised here is somewhat similar to Local Relief Modelling of LiDAR data (Hesse 2010).
Naturally, doing this for the dataset as a whole would be illogical, as sites of significance will tend to fall within a restricted period of time. Therefore, we divided the data up into a series of 250-year time-slices (from 1500 BC–AD 1000) and calculated the probability of each record falling within each time-slice. These probabilities were then multiplied by the quantity of finds represented by each record and this figure used as the 'population' field for the KDE models created (i.e. the numeric value attached to each point that is taken into account when calculating the density). The end result was a series of ten models of nationwide significance. In order to extract 'sites' from these models, each surface was reclassified by octiles and the uppermost octile extracted, as per the ADABS (Abnormal Densities Above Background Scatter) method defined by Millett (1991):
In ArcMap: open Reclassify tool. Click on Classify, select Quantile method, and set the number of classes to 8. Change values for all but the highest value bracket to 'NoData'. Change value for highest value bracket to 1. Run tool. To convert the result to points: run Raster to Polygon and then use that layer as the input for Feature to Point tool.
These areas were then turned into points, which formed the 'sites' of national significance for each time-slice (Figure 12 - a-e and f-j).
At least one further step is required to refine these models: 'sites' that fall on the origin of Ordnance Survey 1x1km grid squares should be removed. These do sometimes represent actual findspots. However, grid square origins are also commonly used in the UK as tethering points for artefacts that are imprecisely located.
This study was carried out as part of the European Research Council funded English Landscape and Identities project (Grant Number 269797). The article APCs were funded separately by an FP7 post-grant Open Access pilot fund. The data employed in the analysis were curated and extracted for us by staff at the Portable Antiquities Scheme, the Fitzwilliam Museum, 84 separate Historic Environment Records, Historic England, and the Archaeological Investigations Project. We are particularly grateful to Dan Pett, who provided the PAS data and kept us abreast with key changes in its makeup over the duration of the EngLaId project, Katie Robbins for her advice on developing the finds affordance model, John Pouncett for talking through the site prospection methodology with us, and the organisers of/participants in the Portable Antiquities Scheme annual conference 2014, from which this article stems. Andy Bevan, Duncan Garrow, Chris Gosden, Tylor Franconi, Letty ten Harkel, Philippa Walton, and an anonymous reviewer, provided extremely helpful comments on an earlier draft of the article.
Internet Archaeology is an open access journal based in the Department of Archaeology, University of York. Except where otherwise noted, content from this work may be used under the terms of the Creative Commons Attribution 3.0 (CC BY) Unported licence, which permits unrestricted use, distribution, and reproduction in any medium, provided that attribution to the author(s), the title of the work, the Internet Archaeology journal and the relevant URL/DOI are given.
Terms and Conditions | Legal Statements | Privacy Policy | Cookies Policy | Citing Internet Archaeology
Internet Archaeology content is preserved for the long term with the Archaeology Data Service. Help sustain and support open access publication by donating to our Open Access Archaeology Fund.