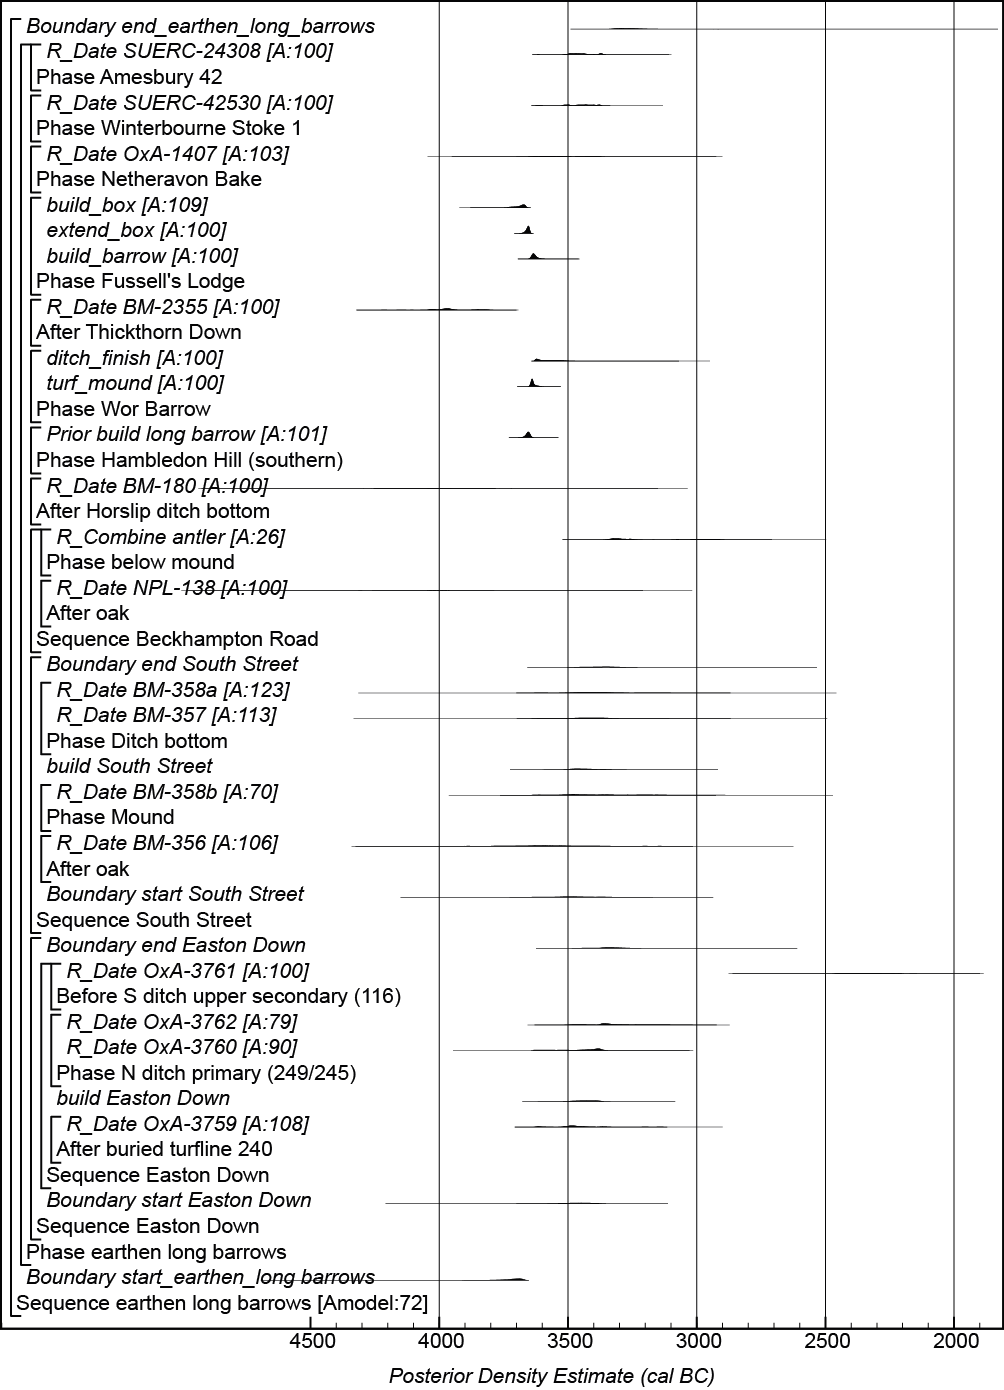
Chronological modelling has been undertaken using the program OxCal v4.2 (Bronk Ramsey 2009a; 2009b; Bronk Ramsey and Lee 2013) and the atmospheric calibration curve for the northern hemisphere published by Reimer et al. (2013). The algorithms used are defined exactly by the brackets and OxCal CQL2 keywords on the left-hand side of the technical graphs that define each model (http://c14.arch.ox.ac.uk/). The posterior density estimates output by the model are shown in black, with the unconstrained calibrated radiocarbon dates shown in outline. The other distributions correspond to aspects of the model. For example, start_earthen_long barrows is the estimated date when the earthen long barrows began to be used (Figure 15). In the text and tables, the Highest Posterior Density intervals of the posterior density estimates produced by the models are given in italics, followed by a reference to the relevant parameter name and the figures in which the model that produced it is defined.
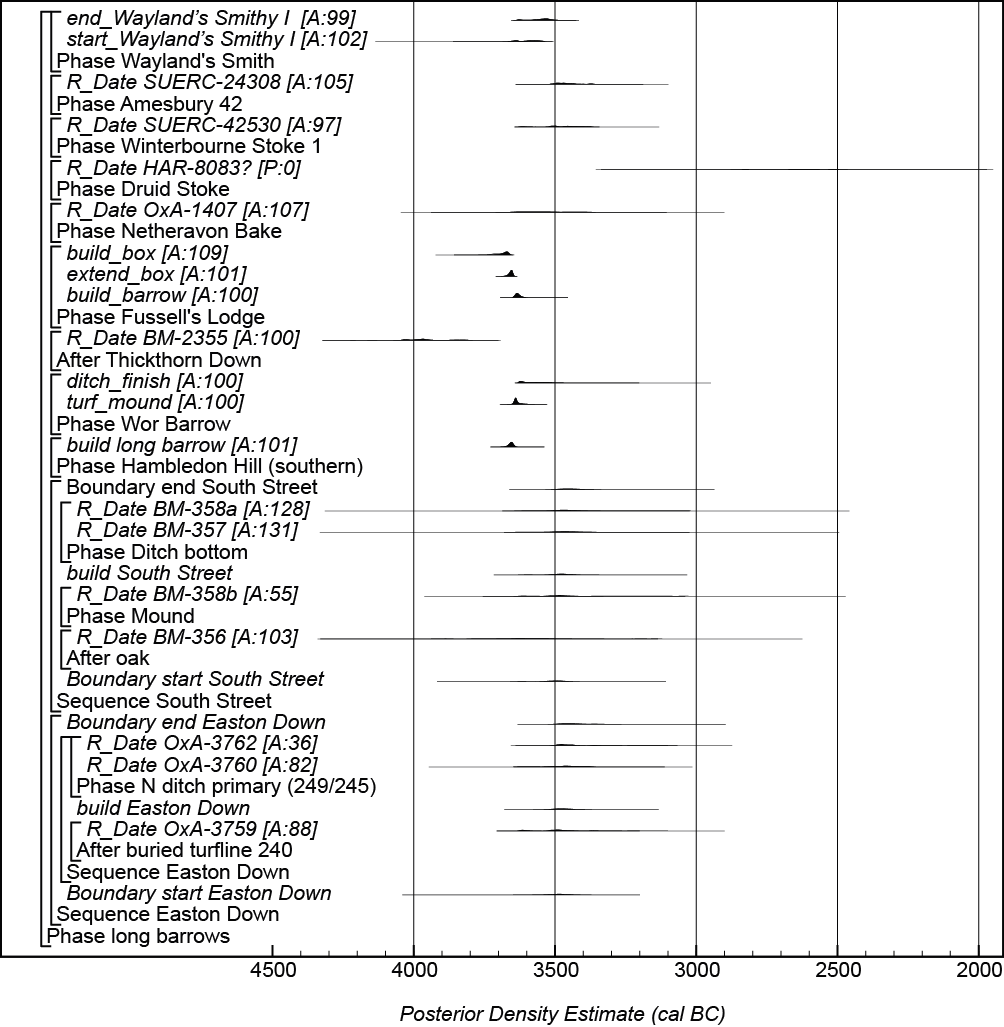
A model for the currency of earthen long barrows in southern Britain is shown in Figure 15. This model is largely based on the data and interpretations set out by Whittle et al. (2011, fig. 14.4) and provides an estimate for the first construction of earthen long barrows in southern Britain of 3810–3660 cal BC (95% probability; start_earthen_long_barrows; Figure 15), probably 3735–3670 cal BC (68% probability). The model estimates that earthen long barrows went out of use in 3355–3055 cal BC (95% probability; end_earthen_long_barrows; Figure 15), probably 3325–3215 cal BC (68% probability).
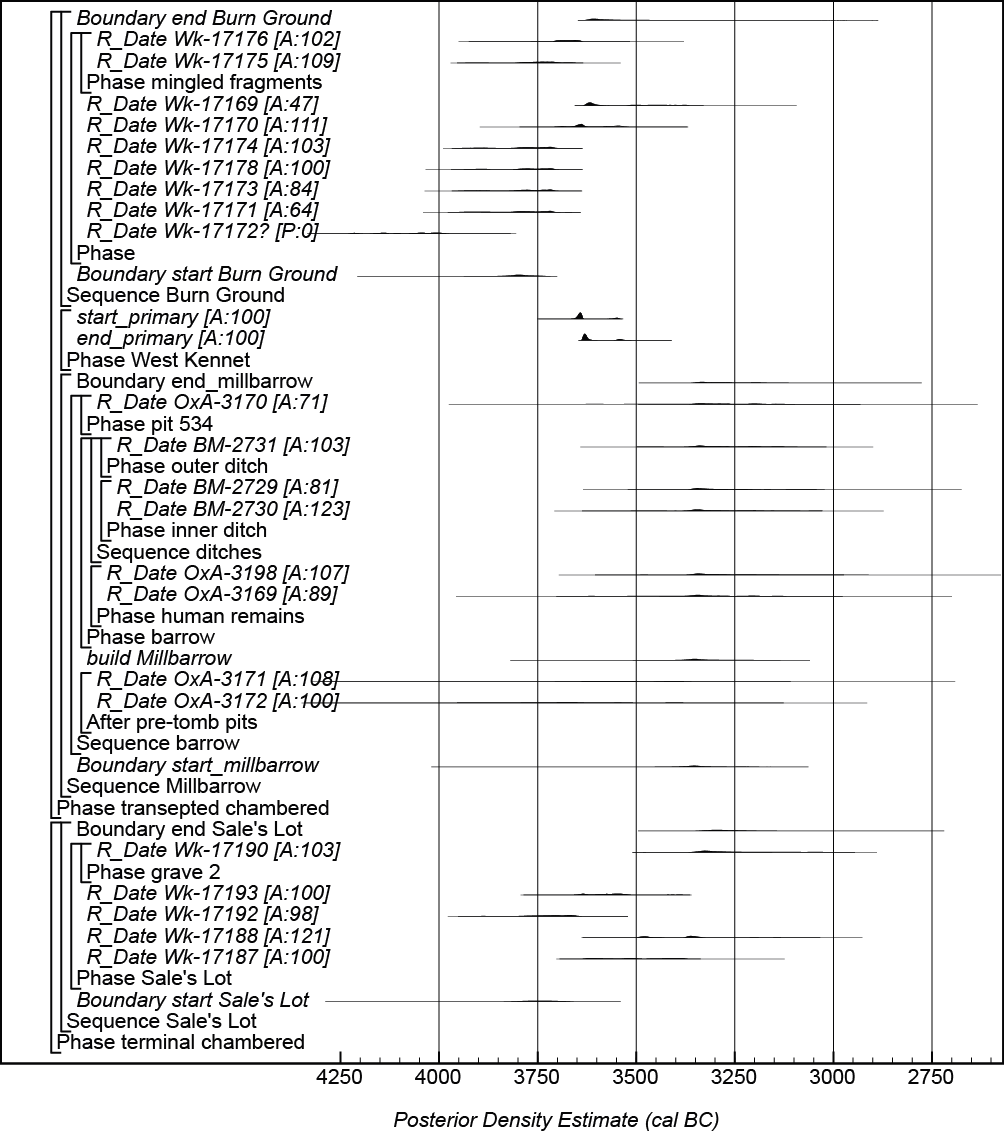
A model for the currency of chambered long barrows, cairns and oval barrows in south-central England is shown in Figures 16–19. This model is largely based on the data and interpretations set out by Whittle et al. (2011, fig. 14.41–42) and provides an estimate for the initial building of long barrows of 3760–3660 cal BC (95% probability; start_long_barrows; Figure 16), probably 3715–3605 cal BC (68% probability), and the end of their primary use of 3490–3280 cal BC (95% probability; end_long_barrows; Figure 16), probably 3460–3350 cal BC (68% probability).
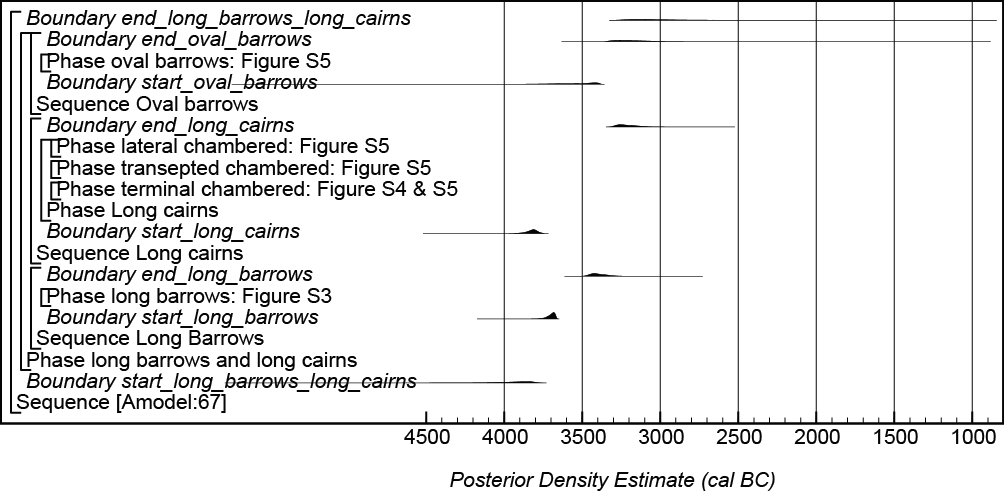
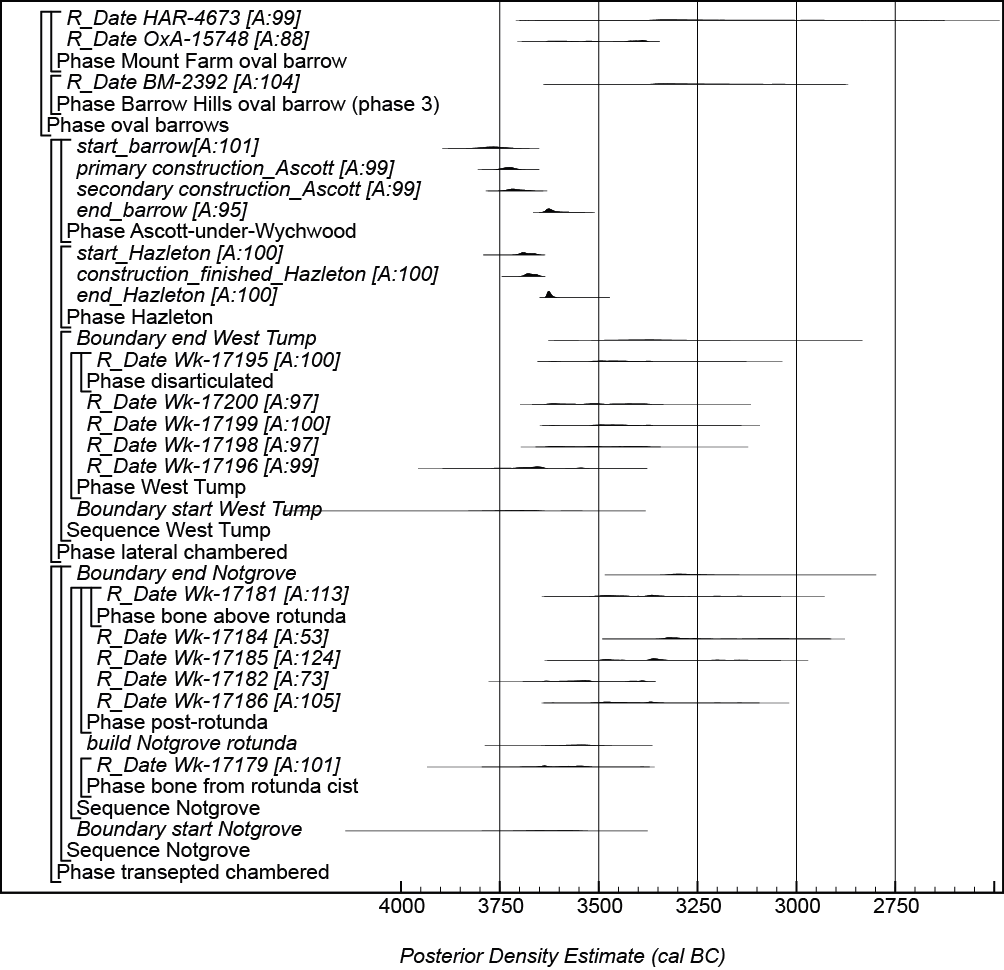
Long cairns are estimated to have been first constructed in 3920–3750 cal BC (95% probability; start_long_cairns; Figure 16), probably 3855–3780 cal BC (68% probability), and their primary use to have ended in 3315–3080 cal BC (95% probability; end_long_cairns; Figure 16), probably 3290–3170 cal BC (68% probability).
Oval barrows are estimated to have been first constructed in 3850–3375 cal BC (95% probability; start_oval_barrows; Figure 16), probably 3630–3385 cal BC (68% probability), and their primary use to have ended in 3360–2905 cal BC (95% probability; end_oval_barrows; Figure 16), probably 3325–3120 cal BC (68% probability).
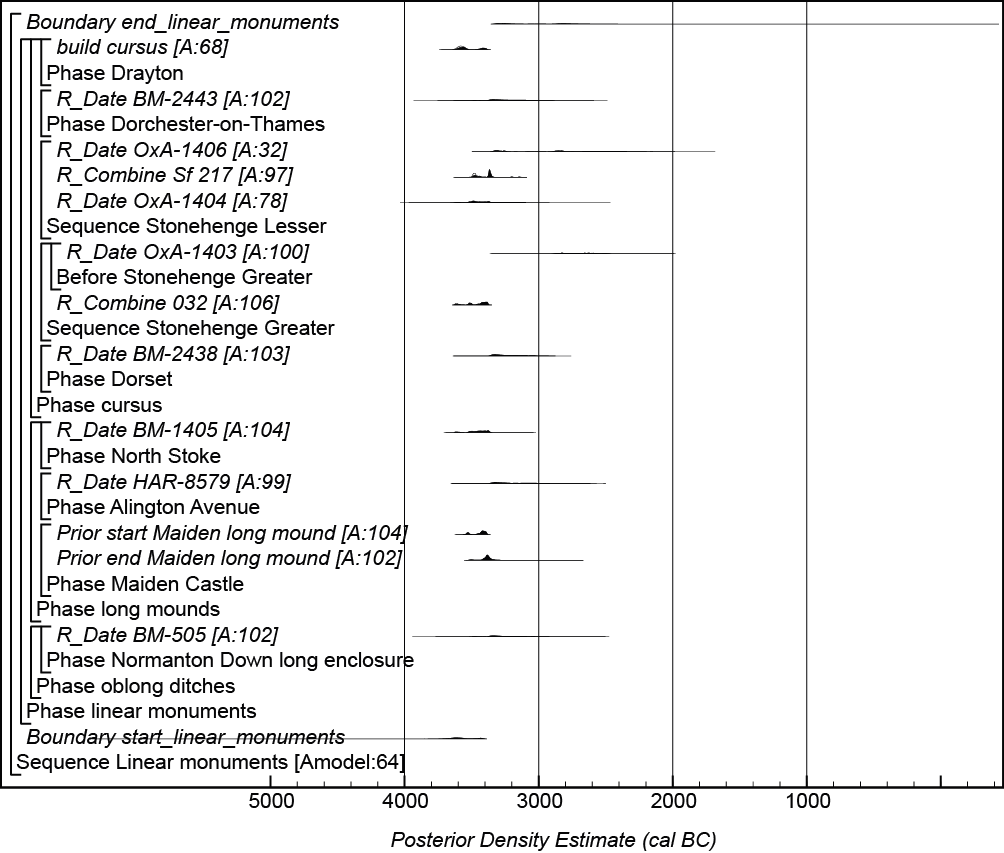
A model for the currency of linear monuments in south-central England is shown in Figure 20. This model is largely based on the data and interpretations set out by Whittle et al. (2011, fig. 14.65) and provides an estimate for the inception of linear monuments in south-central England of 3785–3395 cal BC (95% probability; start_linear_monuments; Figure 20), probably 3680–3545 cal BC (52% probability) or 3470–3410 (16% probability).
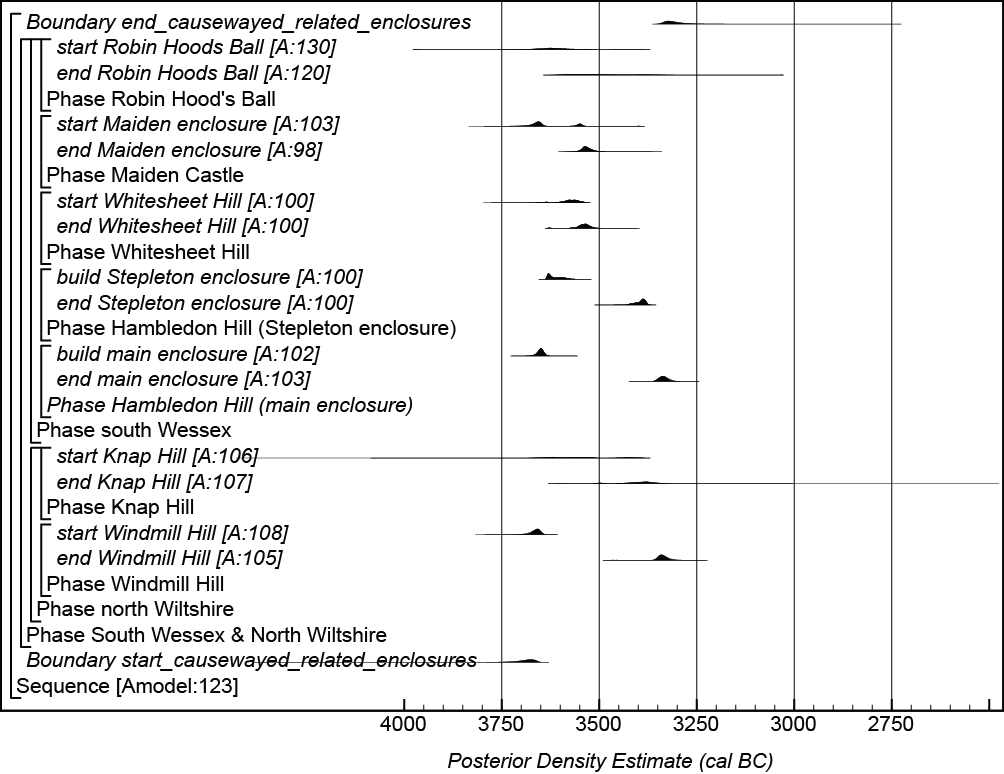
A model for the currency of causewayed and related enclosures in north Wiltshire and South Wessex is shown in Figure 21. This model is largely based on the data and interpretations set out by Whittle et al. (2011, fig. 14.2) and suggests the first causewayed and related enclosure in north Wiltshire and South Wessex was constructed in 3765–3650 cal BC (95% probability; start_causewayed_related_enclosures; Figure 21), probably 3710–3655 cal BC (68% probability). It suggests that the last enclosure in north Wiltshire and South Wessex went out of primary use in 3350–3235 cal BC (95% probability; end_ causewayed_related_enclosures; Figure 21), probably 3340–3290 cal BC (68% probability).
Internet Archaeology is an open access journal based in the Department of Archaeology, University of York. Except where otherwise noted, content from this work may be used under the terms of the Creative Commons Attribution 3.0 (CC BY) Unported licence, which permits unrestricted use, distribution, and reproduction in any medium, provided that attribution to the author(s), the title of the work, the Internet Archaeology journal and the relevant URL/DOI are given.
Terms and Conditions | Legal Statements | Privacy Policy | Cookies Policy | Citing Internet Archaeology
Internet Archaeology content is preserved for the long term with the Archaeology Data Service. Help sustain and support open access publication by donating to our Open Access Archaeology Fund.