A recent compositional analysis of Egyptian cobalt-blue glass from museum collections in Japan (18th Dynasty, probably made at Malkata or Amarna), and from the site of Dahshur (18th and 19th-20th Dynasties), measured using pXRF (portable x-ray fluorescence) in a vacuum atmosphere, concluded that a new source of cobalt was exploited in Egypt after 1250 BC (Abe et al. 2012). These datasets were selected for re-analysis here as they represent one of the few larger modern datasets that were measured by the same research group using the same instrument. Furthermore, the main colourant of these blue glasses was cobalt, exhibiting low copper concentrations (mean = 0.12%CuO; s = 0.16) for all apart from one sample, which had 2.28%CuO. These criteria (i.e. cobalt-coloured/low copper-concentration) were applied to all the data re-examined in this article (i.e. means of all samples: 0.19%CuO, s = 0.32; CoO = 0.15%, s = 0.1). See Legacy Dataset.
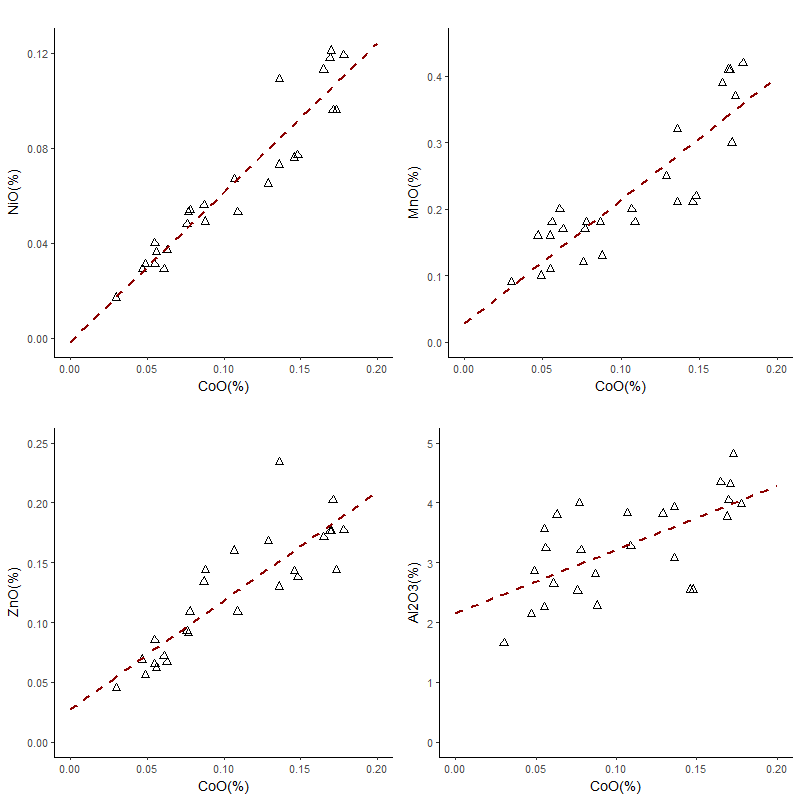
Figure 6 shows bivariate plots of the 18th Dynasty cobalt glass for CoO vs. NiO, MnO, ZnO and Al2O3. The linearity of these plots suggests that these components entered the system together and has been used to support the premise that cobalt can be provenanced to the alum sources of the Western Desert oases mentioned above (Figure 3).
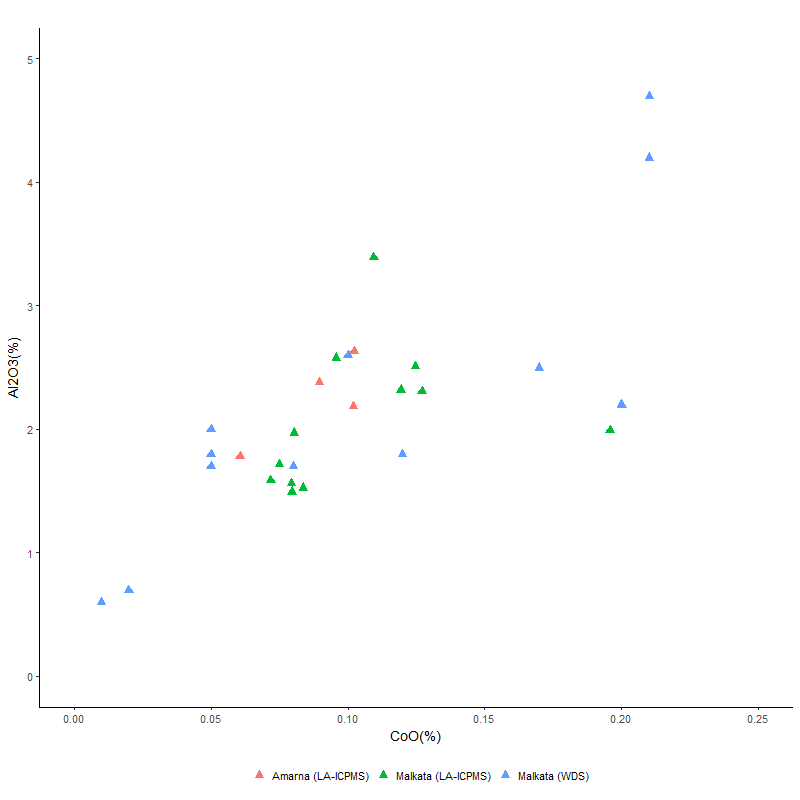
The relationships between CoO and NiO, MnO and ZnO are remarkably linear, with the intercepts of the linear fits being close to the origin, suggesting that these components not only entered the glass system together but derived from a common source. Ternary diagrams of these components were found to cluster tightly for these glasses along with an analysis from a faience object from the 18th Dynasty (Figure 4: Abe et al. 2012). However, a linear relationship between cobalt oxide and alumina is less apparent. The variation is not only higher than the plots of NiO, MnO and ZnO, but the data also indicate a plateau. Figure 7 shows that a similar interaction is also apparent with laser ablation inductively coupled plasma mass spectrometry (LA-ICPMS) measurements on Egyptian cobalt-blue glass from Malkata (green triangles) and Amarna (red triangles) (Shortland et al. 2007; Varberg et al. 2015; 2016). WDS (wavelength dispersive spectroscopy) measurements for the same Malkata samples (blue triangles) are also plotted (Shortland and Eremin 2006), highlighting not only the differences found between the results from different techniques but also why a linear interaction between Al2O3 and CoO has gained so much traction in the academic literature. In essence, taken together, these results suggest that the interaction between cobalt oxide and alumina is not particularly linear, which in turn questions whether alumina entered the system with the cobalt, or at least whether alumina can be considered as diagnostic in order to provenance cobalt.
A re-analysis of cobalt-blue glass data has been conducted treating the system as a series of sub-compositional components, by transforming the data to a log-ratio scale (Aitchison 1986; 2005). This approach removes the effects of the constant sum constraint (which compels the data to lay between 0 and 100%) in order to eliminate any 'spurious correlations' (Chayes 1949). In essence, it considers from the outset that the interest lies in the relative magnitudes and variations of components, instead of in their absolute values. Multivariate analyses were performed using the 'Compositions' package in R created by van den Boogaart (2013), applying Aitchison's geometry (i.e. the centred log-ratio transformation) to the raw compositional data. The dendrograms and ternary diagrams presented use the association of variables from variation matrices in order to detect similar patterns of variation between them. The Ward algorithm was applied as the clustering criterion for the dendrograms (i.e. minimum variance), using the Euclidean distance method as the clustering option. The R package 'clustsig' (Whitaker and Christman 2014) was used to determine which (if any) clusters were significantly different. The null hypothesis was that there was no a priori group structure. The alpha level at which to reject the null hypothesis was 0.05. Dendrograms for individual samples are also presented, derived using the same method.
The distributions of the concentrations of oxides in glasses and frit were investigated by plotting kernel density plots based on a gaussian function using a bandwidth equal to the standard deviation of the dataset. The y-axis was scaled so that the total area of the plot was unity. Y-axis values have not been included on these plots as it was the shapes of the plots (i.e. the density values add little to the understanding of the distribution profile) that were used to assess the compositional profiles of each component in the datasets examined.
The legacy dataset can also be downloaded as .xls
Internet Archaeology is an open access journal based in the Department of Archaeology, University of York. Except where otherwise noted, content from this work may be used under the terms of the Creative Commons Attribution 3.0 (CC BY) Unported licence, which permits unrestricted use, distribution, and reproduction in any medium, provided that attribution to the author(s), the title of the work, the Internet Archaeology journal and the relevant URL/DOI are given.
Terms and Conditions | Legal Statements | Privacy Policy | Cookies Policy | Citing Internet Archaeology
Internet Archaeology content is preserved for the long term with the Archaeology Data Service. Help sustain and support open access publication by donating to our Open Access Archaeology Fund.