A first step in the process of building a soundscape model is therefore to create an acoustic space of church bells. Such an acoustic space is modelled by creating acoustic horizons for each sound source. Sound propagation is modelled using the inverse square law for sound propagation with additional corrections for the effects of diffraction by the topography. The result is determined by the position of the sound source, sound properties (sound intensity and wave length) and topography (DEM).
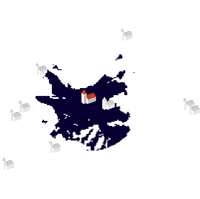
An obvious and straightforward approach is to create a binary acoustic horizon, where raster cells are set to one (1) where church bells can be heard and to zero (0) otherwise (Fig. 3).

Figure 3: The binary acoustic horizon
The radius of the acoustic horizon is extremely sensitive to the environmental factors present and to the choice of sound spreading algorithms. Therefore the result of a binary horizon routine, a binary model of an acoustic environment, is naive, inadequate and misleading and should be replaced by a model that allows a more holistic representation of a soundscape.
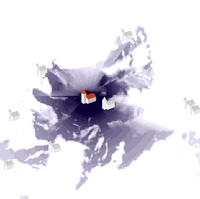
Because of this uncertainty and ambiguity, the effects of incomplete evidence of the complex environmental factors influencing sound propagation cannot be overcome and it should therefore be embraced and incorporated into the model. This is undertaken through the representation of acoustic space as a fuzzy acoustic horizon (cf. Gillings 1998). A fuzzy set approach is a useful tool in complex situations where some variables are ill defined. Modelling sound horizons this way potentially resolves some of the problems already mentioned.
Fuzzy sets are sets for which the definition of set membership is vague or 'fuzzy' and contrasts with a sharp, clearly defined or 'crisp' definition. Fuzziness describes event ambiguity. It measures the degree to which an event occurs, not whether an event occurs (Kosko 1992, 265; see also Openshaw and Openshaw 1997, 268-80). On an interpretative level, the adoption of fuzzy set perspectives promotes a more holistic view of past phenomena, treating them in terms of a series of gradual and transitional changes in state. It challenges the notion that clearly defined categories existed and would have been recognised as such in the past (Gillings 1998, 130-32).

Figure 4: The fuzzy acoustic horizon
The result is a map of gradual transition from 'definitely audible' (dark) to 'inaudible' (white) areas, which can be seen in Figure 4. In practice, membership of the acoustic horizon is defined by the number of memberships in the binary horizons created, where both frequency and loudness of the sound source varies between predefined thresholds.
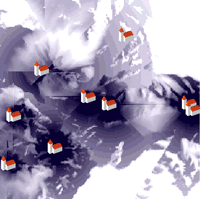
Thus we have arrived at the representation of past acoustic space in GIS: a digital model of a past acoustic space (Fig. 5), which can be defined as a set of fuzzy acoustic horizons and their sound sources.

Figure 5: Clickable map of the digital model of acoustic space
© Internet Archaeology
URL: http://intarch.ac.uk/journal/issue16/6/43.html
Last updated: Thur Nov 11 2004