The means by which this 'testing' of conventional dating can be conducted is straightforward. Using the database, it is possible to plot the relative frequency of a type vis-à-vis all other samian types through time, thereby establishing its actual currency or 'life-span' among stratified samples. To do this, the values for every type present within a specific year were summed and the percentages of the total that each type comprises were established (see Table 81). These percentages were then plotted year on year to generate a chart of the relative frequency of the type over time.
It would, of course, be expected that the relative frequency of a type over time would plot to the form (approximately) of a normal or bell-curve (cf. Millett 1987a, fig. 1). Work of this kind was undertaken during Phase 1, and outcomes were presented and discussed in the article published in The Archaeological Journal (Willis 1998a, illus. 9-13). Illustration 10 in that publication (Willis 1998a) was a good example of the method, plotting the frequency of the familiar South Gaulish platter, Drag. 15/17. This chart is updated here using the large data sample now available (Chart 2 below). This illustration plots the changing percentage frequency of this common South Gaulish (La Graufesenque) platter type in graphic detail over time, year on year; in this case the data are not smoothed – the trend is readily apparent from this raw data. The chart shows the proportion within samian assemblages that the Drag. 15/17 type comprises over time, and should therefore represent a good index of the currency/life-span of this selected type. It was concluded from the earlier phase of this project (Willis 1998a) that in this case the plot showed a close correspondence with the conventional dating of the type (e.g. Webster 1996, 30). The present Chart 2 shows that during the period c. AD 30-60 the type accounts for between 14% and 16% of all samian pottery. There is a marked decline in the frequency of the form through the decade of the 60s, at a time when the platter Drag. 18 was becoming more common. Then follows a 'stability' during the Flavian era at around 5-6%. From c. AD 100 Chart 2 shows a consistent tailing off of examples with a 'residual' tail extending into the 2nd century. Hence in this case there is close agreement between the date of the type as viewed conventionally and the sample of stratified data. The database therefore verifies the established view of the date of the type.

Chart 2:
The Frequency of Samian Forms over Time: The 'Currency' of the Drag. 15/17 Platter (from La Graufesenque) as a Percentage within Samian Assemblages by Calendar Year. (Source: database, exc. Castleford fort (Castl1) and Braughing (Braug1) AD 38-9).

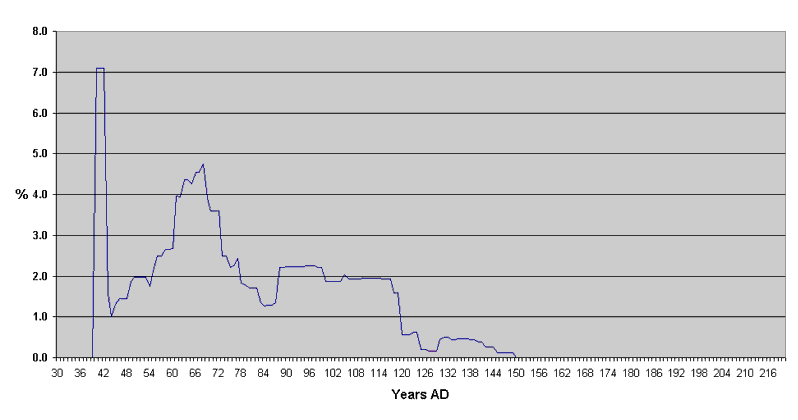
Chart 3:
The Frequency of Samian Forms over Time: the 'Currency' of the Decorated Bowl Drag. 30 from La Graufesenque in Britain as a Percentage within Samian Assemblages by Calendar Year (Source: database).
Chart 3 plots the relative frequency of the well-known decorated bowl type Drag. 30 over time, specifically South Gaulish (La Graufesenque) examples. The plot (again of the raw data) shows an interesting profile. The earliest appearance of the type is in a group dating to c. AD 40. A sharp peak occurs in the chart for the period c. AD 40-42, where the type registers at c. 7% of all samian types for that period. This peak is a function of the comparatively very small size of the sample data at this time: for samian is a fairly rare type in Britain before c. AD 50. In this case the Drag. 30s occur in groups from Dragonby and Snettisham, site 1555 (see 'Drago1' and 'Snett1'). This anomaly apart, the chart shows a clear pattern: a consistent gradual rise in the frequency of the type during the Claudio-Neronian era when it forms c. 4% of the sample. This rise probably reflects the general increase in the proportion of decorated (as opposed to plain) vessels entering Britain from c. AD 45. The early Flavian period sees a steady decline in the frequency of these bowls. Then, through the later Flavian and Trajanic periods the type forms a steady 2% of all samian. Hence South Gaulish examples of this form may still comprise part of the suite of decorated bowls in use in the later Flavian period. Presumably a proportion of vessels continued in use into the Trajanic period, after the end of South Gaulish imports into Britain, though some component of this 2% 'tail' will be residual items. After c. AD 120 (at the time when Lezoux samian begins to arrive in Britain in large quantities) the examples of La Graufesenque Drag. 30 become very rare and disappear from the sample c. AD 150.
© Internet Archaeology
URL: http://intarch.ac.uk/journal/issue17/1/5.4.2.1_2.html
Last updated: Mon Mar 7 2005