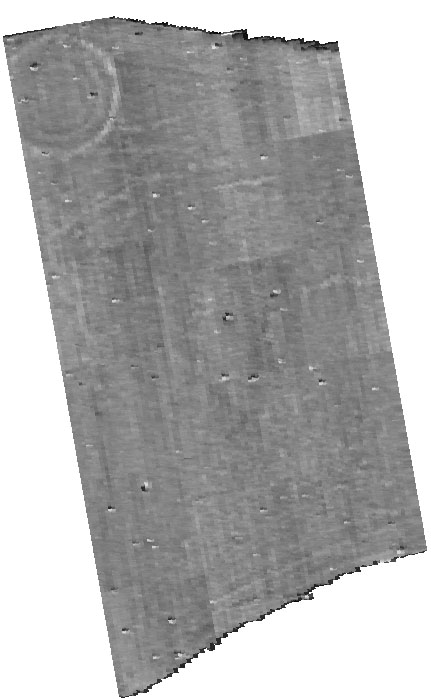
Fig.4 Fluxgate gradiometer survey of triple ditch round barrow.
Three fluxgate gradiometer surveys were used to test the geophysical response on different geologies found in the project area and to compare the results with those derived from the photographic and multi-spectral imagery. A secondary objective was to investigate an area where archaeology was suspected to be present but was not visible from the airborne imagery. A number of other fluxgate gradiometer surveys in the Heslerton Parish Project area, carried out as research and commercial projects by English Heritage (AML) and the Landscape Research Centre Ltd., provide important data which are of further assistance in evaluating the returns from the airborne sensing; in two cases these surveys have preceded full excavation or observation programmes. All the fluxgate surveys were carried out using a 0.25 metre north/south sampling interval and a 1 metre east/west sampling interval, with a 0.1 nanoTesla sensitivity range the de-facto standard for fluxgate gradiometer surveys in Britain.
The first survey area (Figure 4), was chosen to test the magnetic response of the chalk Wolds over a known prehistoric feature. A multi-ditched barrow site was chosen for this test. The barrow is visible on the ground as a low raised mound, and is situated to the east of an upstanding double ditched boundary feature, part of the system of linear landscape boundaries covering extensive parts of the Yorkshire Wolds and known locally as the Wold Entrenchments. The barrow was initially recorded from oblique aerial photographs, and is thought to be one of a number examined in Heslerton by Greenwell, the late nineteenth century antiquary (possibly his Heslerton Barrow VI) (Greenwell and Rolleston 1877). The surveyed area (1.26 hectares), was constrained by tree cover over the Wold Entrenchments, which made it impossible to examine any relationship with the barrow, and the present field boundary to the north. The survey was extended to cover an area 90m wide and c.150m long adjacent to the earthworks. As can be seen from the image (Figure 4), the feature is a triple-ditch round barrow (31 metres in diameter), thus confirming the suitability of using the fluxgate gradiometer for testing purposes on the chalk geology of the Wolds. In addition, a limited resistivity survey was undertaken, limited only to the area over the barrow, to test the instrument response in the same setting; this produced good results, in that the limits of the barrow were clearly visible, but did not provide any additional detail.
Fig.4 Fluxgate gradiometer survey of triple ditch round barrow.
However, it remained to be demonstrated that geophysical surveying would be as successful on the post-glacial sands and gravels in the Vale of Pickering. Sand and gravel deposits tend to give poor gradiometer results by comparison with the magnetically flat response guaranteed on the chalk of the Yorkshire Wolds. It was proposed that tests be undertaken in two areas, one on the edge of an area comprising extensive deposits of aeolian sand over sand and gravel where it meets the adjacent geomorphological zone to the south, and a second at the margin of the flat, once Fen-land, zone in the centre of the valley, along the line of the 'Ladder Settlement'.
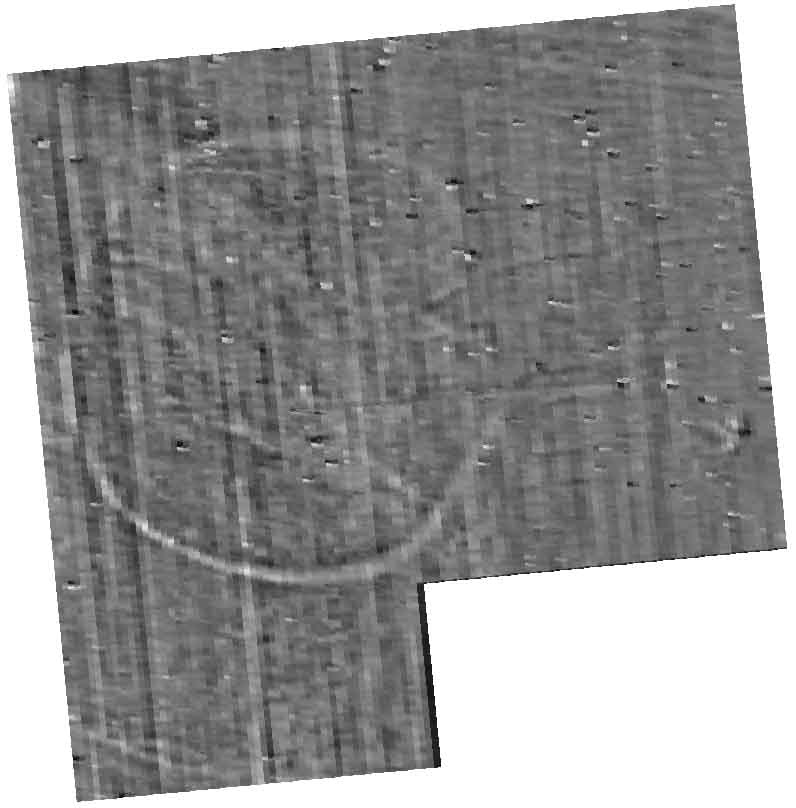
Fig.5 Fluxgate gradiometer survey of the Hengiform structure.
The second test area was chosen to examine a possible hengiform enclosure at the southern edge of the aeolian sand deposits. The site, situated at the base of the scarp slope of the Wolds and identified from oblique and vertical aerial photographs, is also visible in some bands of the multi-spectral image. It is located partially upon a chalk knoll, in a position paralleling an excavated example at West Heslerton, c.1km to the west. Situated in a position extending beyond the chalk knoll into more sandy deposits, the survey provided an opportunity to examine this single large feature in two different geologies. As can clearly be seen from the survey data (Figure 5), the existence of the enclosure was confirmed. The enclosure, measuring c.70m in diameter with opposed entrances to the east and west, closely parallels the excavated example. The entrance to the west is partly obscured by anomalies running north to south indicting the presence of seriously reduced rig and furrow features. The enclosure ditch shows most clearly over the chalky outcrop covering the south-western portion of the feature. The magnetic response clearly reduces as the feature extends into the sandy deposits and is at its poorest in the north-east where the natural sand deposits are enhanced by the presence of aeolian deposits, which being iron-enriched seriously retard the response.
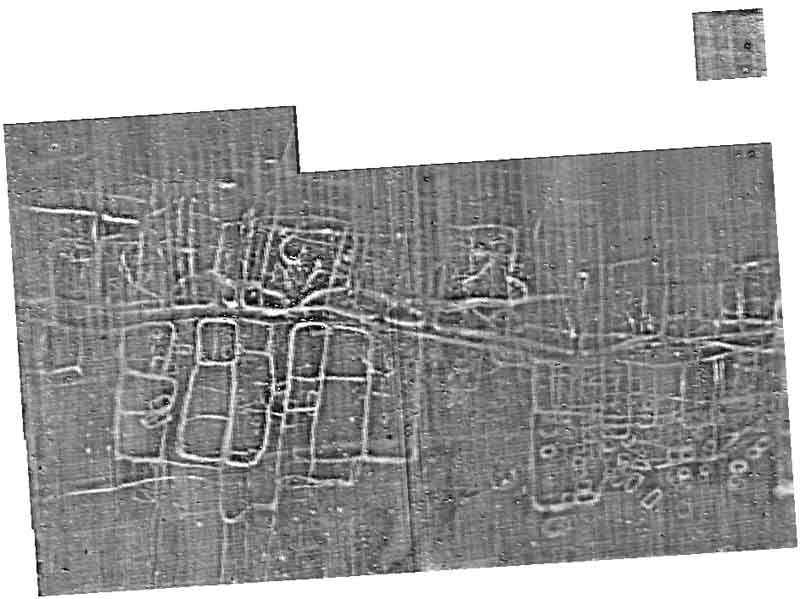
Fig.6 Fluxgate gradiometer survey of Ladder Settlement. (Area 6.87 hectares)
The third area was chosen to examine a part of the Ladder Settlement to the north of the aeolian deposits, but still within the sand and gravel zone. The area had produced good crop-mark results and was situated adjacent to one of the 'gaps' in the Ladder Settlement. A good response in the vertical colour photographs and in the multi-spectral imagery made this an ideal site to test the magnetometer for comparative returns. It was initially felt that the results might be slight on account of the sand and gravel parent material; in fact the results were far better than anticipated (Figure 6). It is likely that the exceptional response in this environment is due in part to the formation of iron-pan deposits which are concentrated in the deep features and are a feature of this low-lying environment which was only fully drained during the last century. As with the second sample area, the introduction of aeolian sand deposits along the western margin of the field have reduced the magnetic contrast and restricted the response. This survey adds a significant amount of detail to the record generated from the examination of the aerial and MSS surveys.
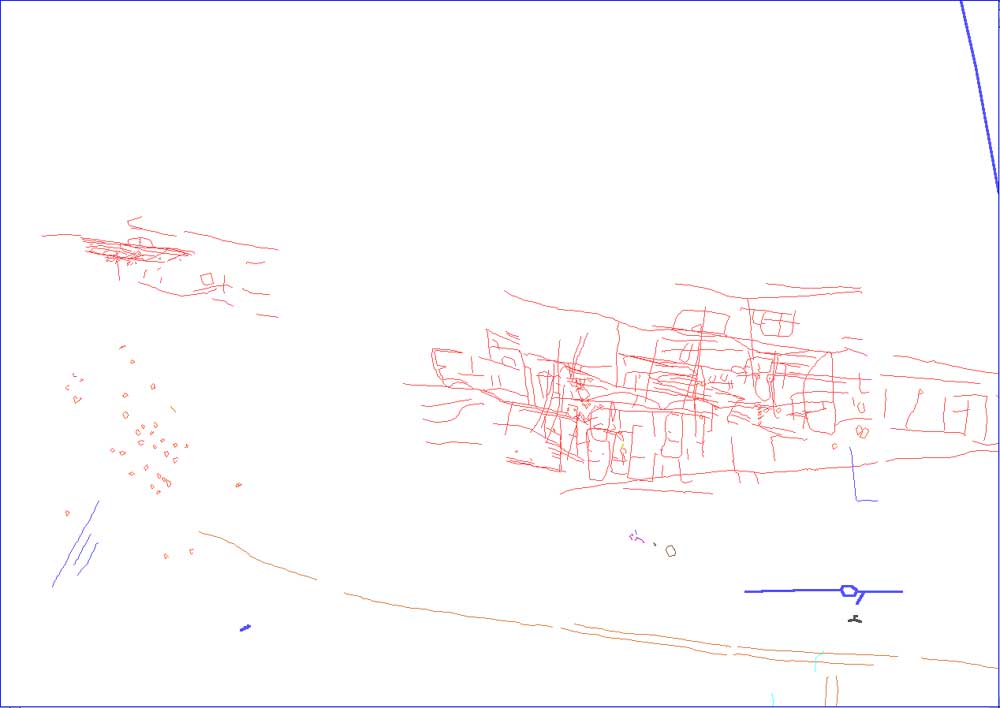
Fig.7 Digitised plots of crop marks from aerial photographs
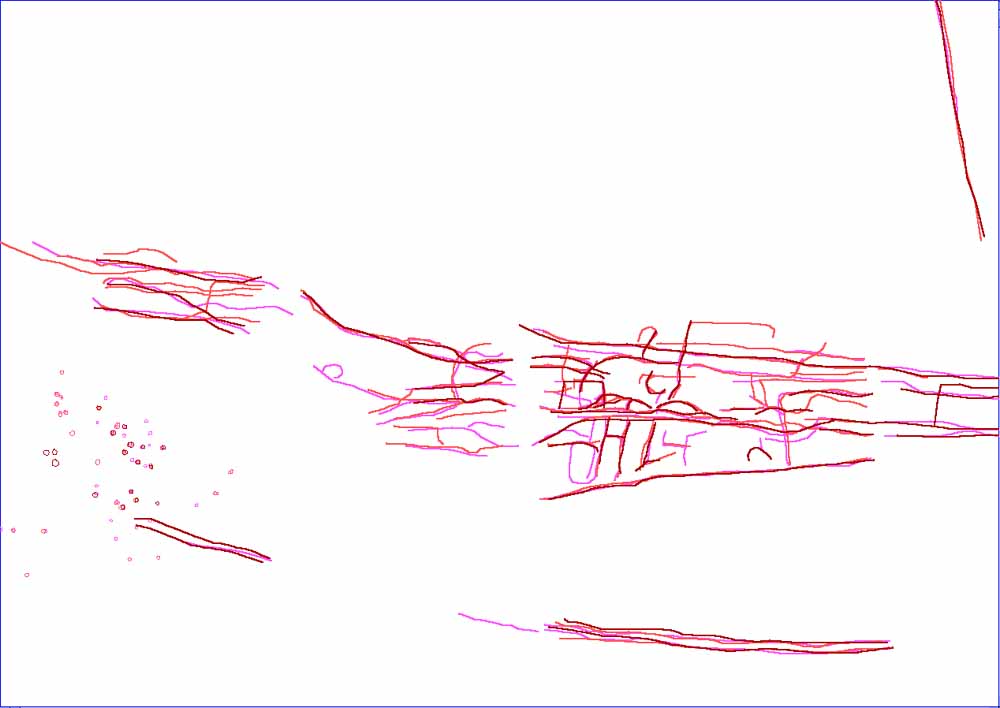
Fig.8 Digitised interpretation of features from the multi-spectral images (bands 7, 10 & 12)
Fig.9 Multi-spectral image of a segment of the ladder settlement
showing a combination of bands 7 and 12.
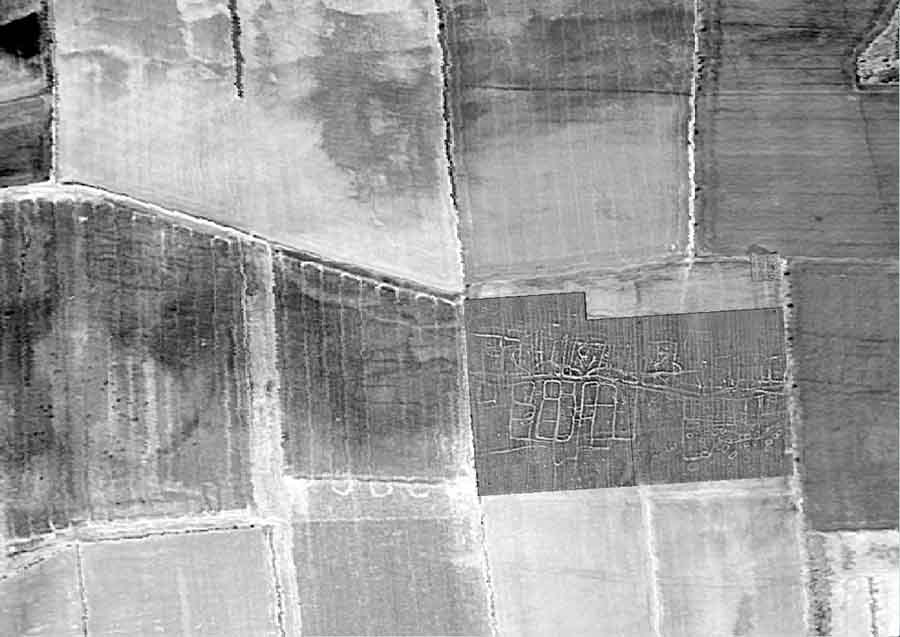
Fig.10 As above with fluxgate gradiometer survey superimposed.
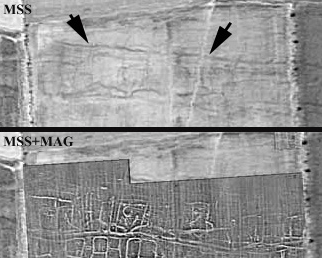
Fig.11 Sub-sections of Figures 9 and 10 combined to show the difference
between the MSS and Geophysical results. Note the dark lines identified by
arrows in the MSS data but not showing in the gradiometer data at all.
Clearly the two methods of remote sensing are complementary (Figures 9 and 10). Although the fluxgate gradiometer survey provides a wealth of detail and clarity, the multi-spectral image shows features not detected by the gradiometer survey. In particular, note the strong dark line in the north of the survey area which is clear in the multi-spectral image (and in the oblique and vertical AP plots), but which does not show up at all in the gradiometer survey (See Figure 11 to compare). The most likely reason for this is that the feature is filled in with material very similar to the surrounding soil, thus not providing the difference in magnetic susceptibility needed to detect anomalies using this method. The gradiometer survey indicates a number of square and rectangular anomalies in the south-east quadrant of the survey area which were not known from the aerial photographic record and were ill-defined in the multi-spectral image.
©
Internet Archaeology
Last updated: Wed Apr 23 1997