Figure 1: Location of the study area in Canada (clickable). Also containing Figure 2: Site locations, Winnipeg study area, all time periods and Figure 3: Site locations, MbMF study area, all time periods
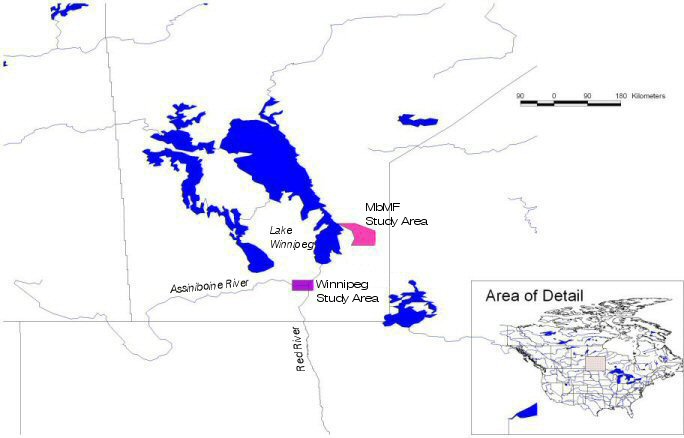
For this project, the proposed temporal predictive modelling methodology will be tested on two study areas. The first area is centred on Winnipeg, representing a typical region of Great Plains/parkland habitation, but with enough archaeological reconnaissance so that there was an adequate availability of data and density of sites. In this case, the study area comprises a single National Topographic Series map sheet (062 H-14). A second study area is located to the north-east of Winnipeg, in the Manitoba Model Forest (MbMF) region, part of the boreal forest in Manitoba and geologically representative of the Canadian Shield. The locations of the study areas are shown in Figure 1.
Figure 1: Location of the study area in Canada (clickable). Also containing Figure 2: Site locations, Winnipeg study area, all time periods and Figure 3: Site locations, MbMF study area, all time periods
While there would probably be a benefit to providing these datasets so that Internet Archaeology readers could experiment with the proposed methodology, most archaeological site locations are subject to controlled access by provincial archaeologists. Since many of the archaeological sites are considered sensitive, especially those associated with spiritual activities of past and present First Nations, access and publication restrictions are placed on site locations and so cannot be replicated here.
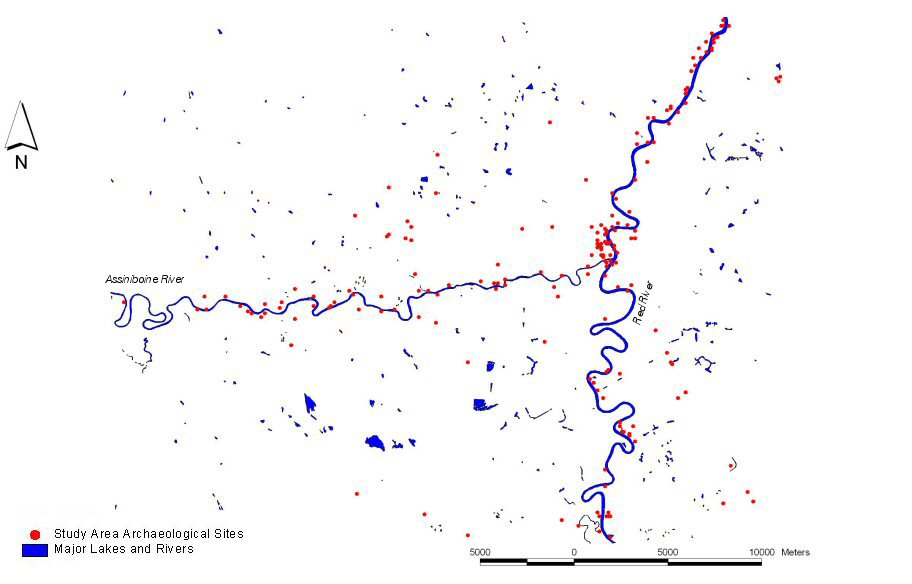
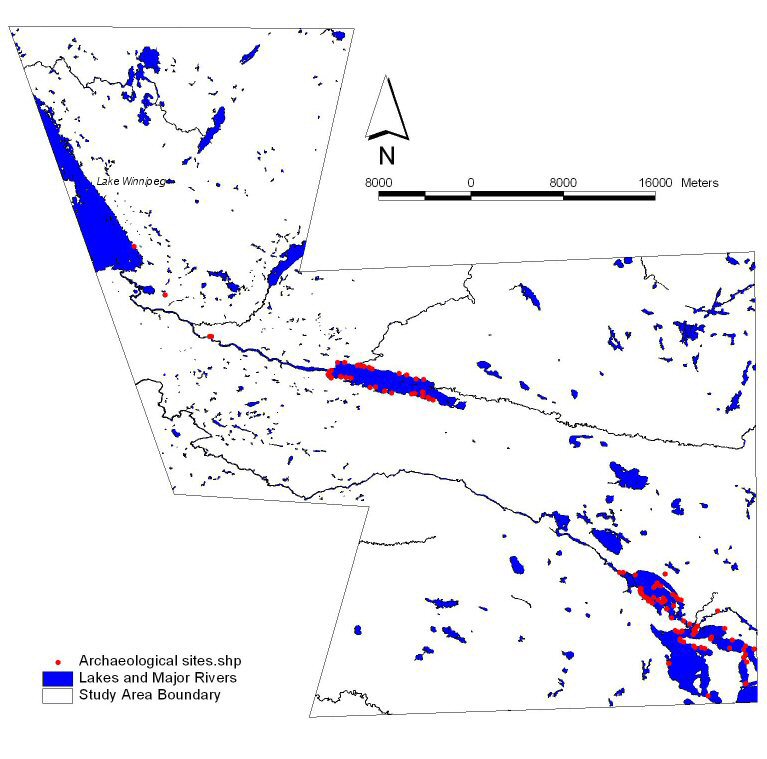
For the purposes of this project, the archaeological record is being divided into four large time periods, plus an unknown category. The time periods are: PaleoIndian, Archaic, Woodland, and Historic. The PaleoIndian, Archaic and Woodland periods represent the time periods before the arrival of the Europeans in North American archaeology, both on the Plains/parkland ecoregions and in the boreal forest. The Historic time period represents First Nations-related sites from after the arrival of Europeans, including fur trade-era sites. A summary of the number of sites and their assigned time periods is shown in Table 1 for the Winnipeg study area, and in Table 2 for the MbMF region. Their locations of all sites are shown in Figures 2 (Winnipeg study area - see Figure 1) and 3 (MbMF study area - see Figure 1), and by time period in Figure 4 (Winnipeg study area) and Figure 5 (MbMF study area). The combined number of sites in each time period may not add up to the total number of sites because some sites had more than one time period of occupation and are included in each time period, as appropriate. The sites are allocated to the time periods, regardless of functional differences, meaning that camp sites and kill sites are treated equally in each of the time periods. However, presumably functional differences in sites would also entail different locational criteria. This added axis of variation is likely an important future consideration which also requires examination, but lies outside the scope of this discussion.
Table 1: Site time period summary, Winnipeg study region
| Time period | Number of sites |
|---|---|
| All time periods | 192 |
| PaleoIndian | 1 |
| Archaic | 36 |
| Woodland | 58 |
| Historic | 130 |
| Unknown | 27 |
Table 2: Site time period summary, MbMF study region
| Time period | Number of sites |
|---|---|
| All time periods | 103 |
| PaleoIndian | 16 |
| Archaic | 19 |
| Woodland | 50 |
| Historic | 4 |
| Unknown | 47 |
For the Winnipeg study area, the PaleoIndian period had only a single site representing that era, and so creates a sample size that is unsatisfactory. Therefore, the PaleoIndian time period had to be excluded from consideration. This lack of sites is related to the deglaciation history of the region, and its submergence under Glacial Lake Agassiz for much of the PaleoIndian time period. While there are more sites for the PaleoIndian period in the MbMF study region, the Historic period is under-represented and therefore must also be excluded from consideration.
The environmental data employed in the project are the standard data from National Topographic Series (NTS) maps. Supplemental elevation data for the Winnipeg study area was obtained from the Manitoba Land Initiative website, which had a GPS-based elevation survey for the region. These survey points were combined with NTS elevation data to create the digital elevation model (DEM) for the Winnipeg study area, as shown in Figure 6. The DEM for the MbMF study area was obtained from air photo interpretation of elevations provided for the author's research, and is shown in Figure 7.
From a DEM, the GIS will calculate the slope of the ground surface, as well as which way the ground surface faces, known as its aspect. The slope is shown in Figure 8 (Winnipeg study area) and Figure 9 (MbMF study area), and the aspect in Figure 10 (Winnipeg study area) and Figure 11 (MbMF study area).
The two study areas both have significant water resources. For the Winnipeg study area, three themes of hydrologic data from the NTS maps were used to create distance surfaces. Water was classified as major water (lakes and major rivers), minor water (minor rivers and streams) and wetlands. Major river systems are important in the Winnipeg area, featuring a confluence of the Assiniboine and Red Rivers, known ethnographically to be an important gathering location for Aboriginal groups. For the MbMF study area, the NTS hydrologic data was also used, but the focus on hydrology data was restricted to major water (lakes and major rivers) and minor water (minor rivers and streams). Wetlands in the forest tend to be somewhat more short-lived and related to low-lying land. For both study area, all types of hydrology data were buffered for distances of 100m, 200m, 300m, 400m, 500m and more than 500m away from each particular type of water source. For the Winnipeg study area, the distance to major water is shown in Figure 12, minor water in Figure 13, and wetlands in Figure 14. For the MbMF study area, distance to lakes and major rivers is shown in Figure 15 and minor rivers and streams in Figure 16.
For both study areas, other data were available, such as soils, vegetation and tree types. However, these data were not adopted, because of varying scales, resolutions and data completeness. It is necessary when employing logistic regression to have complete data coverage in order that the formulae are equally applicable across the entire study area.
© Internet Archaeology
URL: http://intarch.ac.uk/journal/issue20/2/4.html
Last updated: Wed Aug 9 2006