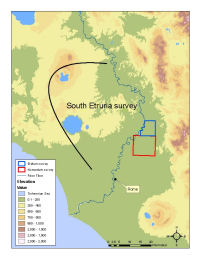
Figure 11: Location of the Eretum survey (part of South Etruria survey)(part of the Forma Italiae series).
A final example of the use of GIS with legacy data uses the evidence from two surveys in northern Lazio: the South Etruria survey and another Forma Italiae volume. The South Etruria survey is one of the pioneering Mediterranean regional surveys covering c. 1000km² of territory to the north of Rome (Potter 1979); here attention will focus on just one small sub-project, the Eretum survey (Ogilvie 1965). Subsequently, many other topographical and regional field surveys have been conducted in this region, including a c. 100km² survey by Pala (1976) around ancient Nomentum (Figure 11).
Figure 11: Location of the Eretum survey (part of South Etruria survey)(part of the Forma Italiae series).
The longevity and intensity of archaeological survey in this area provides plenty of examples of the problems and potential of comparing legacy data within a GIS environment. Digitisation of these surveys' results allows settlement patterns to be queried and mapped, but it does not mean that it is possible simply to forget about the disparate methodological origins of the data. One of the key problems for comparative survey concerns the disparate chronological frameworks used. Not only might regional chronologies differ, but individual surveys might (and, in fact, often do) define their own dating schemes (e.g. 300 BC-1 BC vs. 250 BC-27 BC vs. 'Republican'). In terms of comparison, these schemes are simple to record with formal metadata (though practicable strategies for integration are less straightforward). However, there are other aspects of survey chronology that are more difficult to document. How far has a survey made (full) use of fine- and coarseware typologies? How does knowledge of (local) ceramic sequences vary across time and space? As a result, the comparability of chronological information from legacy data is far more problematical than the more familiar problem of comparing spatial information. However, GIS can help to visualise these problems and therefore to manage them.
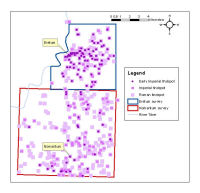
Figure 12: Chronological variability of Roman findspots (Eretum and Nomentum).
For example, in Figure 12, findspots are plotted according to dating resolution - generic Roman (c.350 BC-AD 250), imperial (c.31 BC-AD 250) and early imperial (c.31 BC-AD 100). The symbols are 'stacked up'; the smaller and darker the symbol, the more closely it is possible to date the findspot. The distribution of symbols indicates clear differences in levels of chronological resolution achieved by the Eretum survey and the Nomentum (Forma Italiae) survey. Here, the greater dating precision of the Eretum survey is the result of a strong emphasis on ceramics for dating, while the more generic chronological identifications of the Nomentum survey reflect its reliance on structural remains and inscriptions. A simple map of early imperial findspots (with none of the more generically dated sites) would indicate a strong, but misleading, cluster of activity around the site of Eretum which might (wrongly) suggest Eretum was a vibrant market centre at this date. Such visualisation techniques are a powerful means of data characterisation. The resulting contextual metadata are critical for the analysis, interpretation and comparison of legacy data.
© Internet Archaeology/Author(s)
URL: http://intarch.ac.uk/journal/issue24/2/3.5.html
Last updated: Mon Jun 30 2008