Two main base maps have been produced against which the VASLE data can be assessed. These are designed to evaluate the data on several levels, allowing the observation of trends.
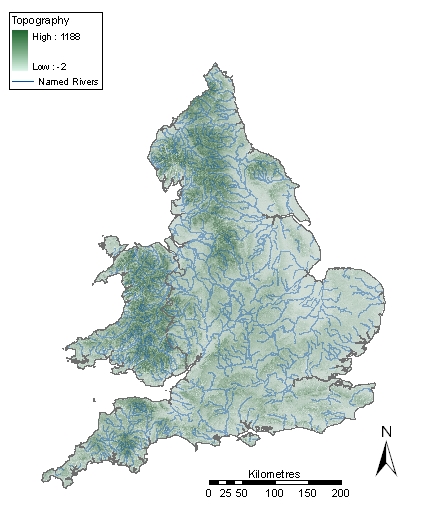
The topographic base map (Fig. 1) allows easy comparison between the datasets, height of land and rivers. It will be of use in discussing differences between lowland and highland zones in the light of conclusions based upon the 'constraints' base map. It was produced using the Bartholomew GB2003 dataset for coastlines, rivers and national boundaries. Only named rivers are shown in order to limit the mapping of rivers to significant watercourses. The topographic mapping is derived from the Ordnance Survey LANDMAP relief dataset.
Figure 1: Topographic base map, showing relief and major rivers (derived from Bartholomew GB2003 and Ordnance Survey LANDMAP datasets)
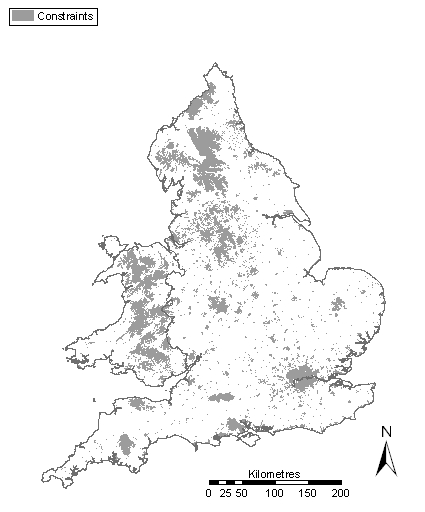
Figure 2: Constraints base map, showing urban areas, forests, lakes, and danger zones (derived from Bartholomew GB2003 dataset)
The constraints base map (Fig. 2) is specifically designed to assess potential biasing factors affecting data recovery. This has not been previously attempted in a systematic way on a national scale, and it provides a form of 'visibility template' against which the finds distribution can be overlaid to assess whether gaps are real, or simply a product of visibility and recovery factors. It therefore allows examination of the distribution patterns produced by ancient settlement and artefact use and loss in relation to modern factors influencing recovery. The constraints map was produced using the Bartholomew GB2003 datasets (including urban areas, forests, lakes, and danger zones) and the LANDMAP relief dataset for which the 300m contour provides a useful approximation for the limits of ploughzone farming, as been determined through comparison with the Countryside Information Service (CIS) dataset for cereal farming in England and Wales. Danger zones are military practice areas and firing ranges which are not normally available for prospection by casual metal detector users.
While the constraints maps are useful tools in helping us assess real gaps in artefact distributions, it must be acknowledged that they fail to capture all factors affecting data recovery in a systematic way, given other biases that are difficult to quantify.
The interactive mapping also allows finds distributions to be overlain against a basic map of the Roman roads network, derived from Margary (1973, maps 11 and 17). In the past, much emphasis has been placed on the correlation of metal-detected finds with communication routes, and in particular Roman roads (e.g. Naylor 2004; Ulmschneider 2000b). It should also be noted, however, that the modern motorway and A-road network is also correlated with the Roman road system and this may act as a further biasing factor, encouraging finds recovery in the vicinity of major modern trunk routes.