The entire PAS dataset amounts to a total of 137,090 records, of which 122,067 (89.0%) have at least a four-figure grid reference. Figure 3 shows overall distribution of all finds against geographic features (topography and rivers), and Figure 4 the same data against possible constraints on data recovery, namely urban areas, the limits of the ploughzone, lakes, forests, and danger zones. The interactive mapping section also allows the addition of Roman roads (plotted using Margary 1973, maps 11 and 17). Figure 5 represents the data as a kernel density plot, with greater density represented by darker shading.
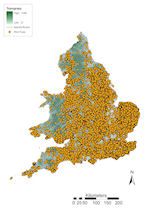
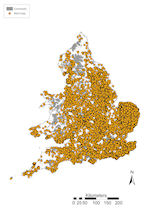
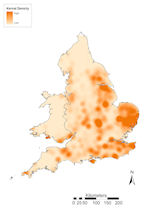
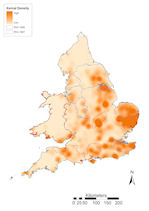
Figure 3: Overall distribution of all PAS finds against topographic base map
Figure 4: Overall distribution of all PAS finds against constraints base map
Figure 5: Overall distribution of all PAS finds presented as kernel density plot
Figure 6: Kernel density plot overlain with 1997 and 1999 PAS areas
There is, in general, a greater concentration of finds in the south and east, and into the central Midlands, with fewer records from the north-west, Wales and the south-west (Devon and Cornwall), apart from a coastal scatter. Nonetheless, there are concentrations of finds in the coastal regions of Lancashire, the Cheshire Plain and in south-east Wales. Figure 3 broadly illustrates the lack of finds from over 100m OD, and the perceived constraints on data collection (Fig. 4) do appear to result in a dearth of finds, which follows the trends seen in modern settlement patterns. In both cases, Section 2.4.2 provides more sustained discussion. Finds density is lowest to the north and west of the River Trent, west of the Pennines, and along the Thames valley. This general pattern must, in part at least, be placed against the evolution of the PAS recording areas).
Figure 6 shows the kernel density of finds overlain with the PAS's 1997 pilot scheme areas and its extension in 1999 highlighted. This shows clearly that the majority of areas with the highest concentration of finds are in these regions or adjacent to them, Northamptonshire and Warwickshire being good examples, which probably indicates finds made by people living in these early recording areas. Exceptions to this are concentrations visible in southern Lincolnshire and Leicestershire. Obviously these may be due to finders travelling from other areas, but the strong links built up with the region's detecting community by the North Lincolnshire Museum prior to the establishment of the PAS should not be underestimated. Norfolk also presents a lower concentration of finds than expected, especially when compared with Suffolk, producing under half the number of finds. However, the county already had a well-developed recording system in place and as such still only uploads a selection of finds onto the national PAS database, the remainder staying within the local HER. Of importance, however, is the dearth of records from three of these early recording areas: the north-west, West Midlands and Wales. The fact that all three regions are located in the west of the country may indicate that the national distributions do show a combination of differential access to metals, or use of portable metal objects, and historically lower densities of population.
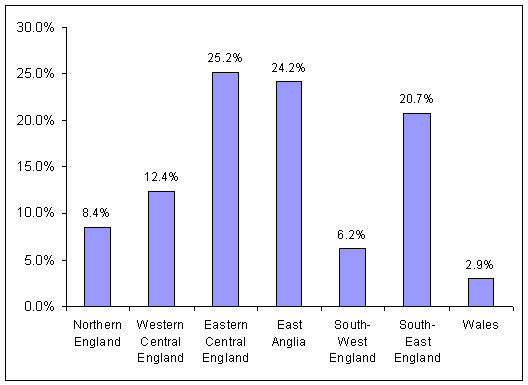
Within the national dataset, Figures 7 and 8 show the data broken down by both region and period. Figure 7 follows the interpretation of the distributions, showing nearly 70% of all records relate to eastern central England, East Anglia, and the south-east. Areas to the north of the Humber and in the west have produced a comparative dearth of material, especially in the most westerly areas. Figure 8 illustrates that prehistoric material is rare, providing 10.4% of all records, with Roman and Late Medieval material accounting for over half of the dataset, and a massive decline in material circulating during the Early Medieval period.
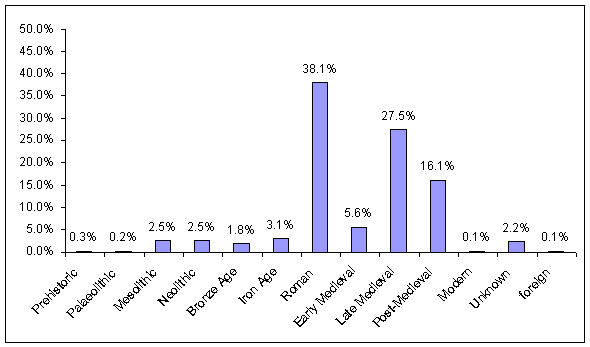
Figure 8: Chart showing PAS finds by period
As expected, the perceived constraints on data recovery (Fig. 9) result in relatively few finds, with areas designated as lakes, forests and danger zones accounting for only just over 1% of all records, and urban areas less than 5%. This accords well with the latest figures from the PAS, which state that under 10% of finds reported between April 2005 and April 2006 were from uncultivated land (PAS 2007, 7).
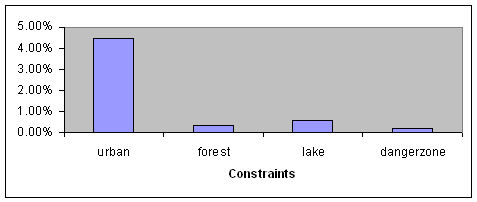
Figure 9: Chart showing constraints on data recovery as percentage of database
© Internet Archaeology/Author(s)
URL: http://intarch.ac.uk/journal/issue25/2/2.4.1.html
Last updated: Tues Apr 21 2009