PREVIOUS
NEXT
CONTENTS
HOME
3. Methodology
I chose to use the technique referred to by Hillier and Hanson as "gamma-analysis" (Hillier and Hanson 1984, 147) to study access at HP4. This generates data that can be used to gain an understanding of how people and animals would have moved around the site. The clearly defined fence lines of this hut platform make it a suitable subject for analysis of this sort, as does the preservation of the entrances to most of the buildings. Hillier and Hanson make a distinction between "alpha-analysis", used for settlements, and "gamma-analysis", used for buildings — or, more precisely, "premises" (Hillier and Hanson 1984, 147). My choice of the latter type of analysis represents my interpretation of HP4 as a "subdivided cell within a continuous open space" (Hillier and Hanson 1984, 147), rather than as a "continuous open space containing a number of cells" (Hillier and Hanson 1984, 89). The method used in this study is presented in Quantifying Spaces as a series of instructions for purposes of clarity and conciseness.
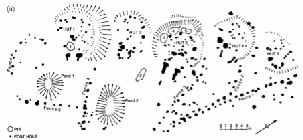
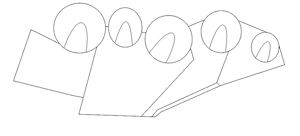
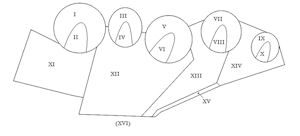
Figure 1: (a) General plan of Hut Platform 4, after Drewett (Drewett 1982, 326); (b) Identification of spaces within the hut platform, produced from Drewett's figs 5 and 9 (Drewett 1982, 327, 335). The semi-elliptical spaces within the huts represent the areas illuminated by natural light through the doors, which includes the spaces within the porches.
The numbers representing the order of control and Real Relative Asymmetry (RRA) values across the site were used to allow visual comparison of the results of gamma-analysis with the locations of relevant artefacts and ecofacts within the site. The following steps give details of the process by which this was done.
- Using a computer imaging program, modify copies of the template with codes for each part of the site (Figure 2) to show each configuration group, ensuring that there are no breaks in the lines separating the spaces and leaving all codes on the image (these will be needed in step 3). Create two images for each configuration group, one showing the order of control values and the other doing the same for RRA values. In each case, select a colour that will be varied in luminescence from dark to light according to the values for each space. Colour the part of the site with the highest value black using the fill tool (the luminescence of the chosen colour being set at 0). Each space is then to be filled with a progressively lighter colour according to its place in the descending order of values.
- Use the site report to plot finds and features on the template with codes for each part of the site, showing what was found where (it is not necessary to show exact locations of finds, just the spaces in which they were found). See Plotting Finds.
- The image showing what was found in each part of the site can now be compared to the images showing the orders of control and RRA values. At this point, one must form a personal interpretation of the relationship between these images.
PREVIOUS
NEXT
CONTENTS
HOME
© Internet Archaeology/Author(s)
University of York legal statements | Terms and Conditions
| File last updated: Wed Dec 7 2011