Back | Forward | Close Window
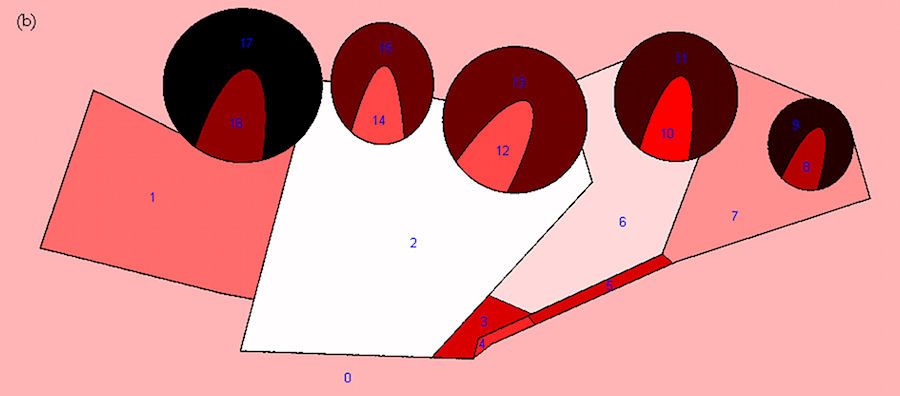
Figure 7b: Image showing order of real relative asymmetry values for the spaces in my new interpretation of HP4. In both cases, darker shading indicates a higher value, lighter shading a lower value. It should be remembered that high control values represent spaces with strong control, whereas high RRA values represent spaces with a low level of integration into the system.