Back | Forward | Close Window
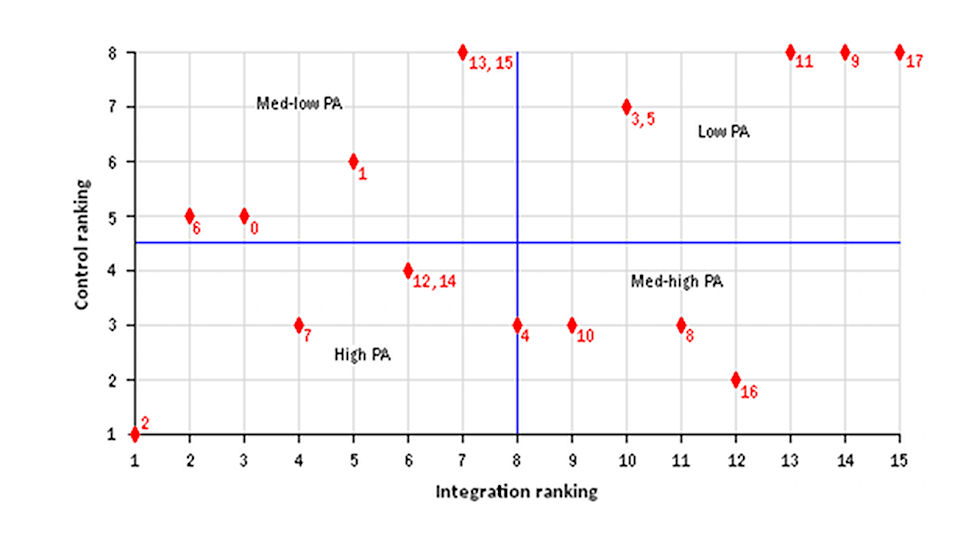
Figure 8: Scatter graph plotting positions of each space in rankings of control values and integration (RRA) against one another.