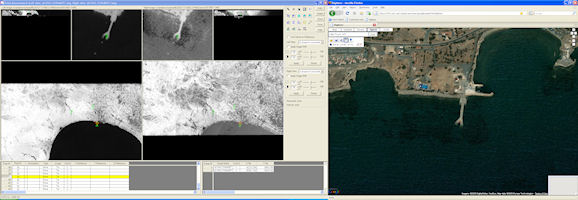
Figure 7: Screen shot of ground control point selection on CORONA images in ERDAS Leica Photogrammetry Suite (left) and Google maps data via a custom-built point digitizing tool (right)
Because most necessary information (camera parameters, satellite position and orientation, etc.) for automated orthorectification of CORONA is not available, much of our work on the CORONA Atlas project has been dedicated to essentially reverse engineering the image correction process. Our efforts have now developed a method for efficient, rigorous orthorectification of full CORONA scenes, a process that corrects image distortion based on a mathematical model of the camera and its relationship to the ground surface. A general panoramic sensor model of the type used by CORONA has been published (e.g. Habib and Beshah 1998), but attempts to triangulate CORONA imagery using commercial software packages have had limited success (e.g. Galiatsatos 2004; Galiatsatos et al. 2011; Gheyle et al. 2011). Other researchers have developed rigorous models specifically for CORONA KH-4A and KH-4B processing that take into account the dynamic geometry of the panoramic scanning system (Schenk et al. 2003; Shin 2003). Sohn et al. (2004) developed two rigorous models and also compared them to higher‒order rational polynomial models. Both of these research teams reported that 2nd or 3rd order rational polynomials could produce accuracies comparable to rigorous models but they require many more ground control points. Rigorous models like these are necessary for traditional photogrammetric mapping activities like digital terrain modelling, planimetric mapping and orthorectification (Xiong and Zhang 2011). However, because comprehensive and rigorous processing of full-frame CORONA imagery in commercially available packages has been unsuccessful to date, archaeologists have been unable to orthorectify images over large landscapes or to utilise the stereo capabilities of full-scene CORONA imagery, which enable landscapes to be viewed in three-dimensions and high-resolution digital elevation data to be extracted directly from the imagery. Our methodologies for efficient orthorectification of full CORONA scenes, outlined briefly below, are described in more detail in Cothren et al. (in press).
The United States Geological Survey (USGS) who distribute CORONA imagery, has since 2004 provided CORONA images in digital format. Due to its large dimensions, CORONA film negatives are scanned in four parts, and the user obtains these files separately. Therefore, any study dealing with a large number of CORONA images has to develop strategies to automate the process of stitching the parts back into original sizes of CORONA image strips. We perform this automation with the help of scale-invariant feature transform (SIFT) algorithms, a computer vision algorithm which detects local features in a digital image (Lowe 2004) built over open source library functions (Vedaldi and Fulkerson 2008). The SIFT detector extracts a large number of robust frames from an image that can be directly compared to other frames from other images since these frame signatures are all illumination, scale, and viewpoint invariant. With this approach, it is possible to merge images by tying the frames together. By automating the SIFT process, we are able to reconstruct large numbers of CORONA images efficiently and with a high degree of accuracy. Once reconstructed, images are assembled into blocks containing from 10-50 images that are part of a single revolution of a satellite, and thus were taken within a few minutes of one another. Because original fiducial marks are not visible on many scanned CORONA images, we also then generate a series of pseudo-fiducials that mark the corners of scanned images to determine image size.
Figure 7: Screen shot of ground control point selection on CORONA images in ERDAS Leica Photogrammetry Suite (left) and Google maps data via a custom-built point digitizing tool (right)
Unlike modern satellite images, CORONA images do not have high-quality position and orientation information available, and so these variables must be estimated using measured ground control points (GCPs)—points identifiable on both CORONA images and modern, orthorectified imagery. Because of the massive transformations in the landscape since CORONA was taken, finding features visible on both CORONA and modern imagery is challenging and time consuming. We have relied on Google Maps image data to locate horizontal ground control points. While many questions persist regarding the spatial accuracy of images served by Google, there is simply no other practical source for ground control across the enormous area we cover in the CORONA Atlas project. Furthermore, the subsequent bundle block adjustment step finds the best match among all ground control points and will thereby eliminate any that are too far off from their expected image location. To facilitate the ground control point collection process, we developed a custom-built point digitising tool using Google's Application Programming Interface (API). The tool enables us quickly to collect and store points from Google data while simultaneously locating the same points on CORONA images within ERDAS Leica Photogrammetry Suite (Figure 7). For each CORONA scene, we collect 15–20 GCPs, spread across the entire images, primarily in areas of overlap between successive images in a block (Figure 8). The elevation of these locations is then derived from an SRTM Level 1 digital elevation model, which provides reliable and sufficiently high-resolution elevations for our process.
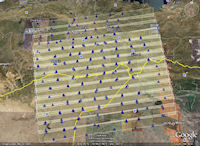
Figure 8: Location of ground control points used to orient a large block of CORONA images. Note that relatively few GCPs are required if they are well positioned along areas of image overlap
The third step in the process is commonly termed bundle adjustment, in which the orientation of CORONA scenes are estimated simultaneously. Unlike modern satellite images, the orientation of CORONA images cannot be obtained via direct means and must be estimated indirectly using ground control points. Following a solution proposed by Sohn et al. (2004), a rigorous sensor model is created for each CORONA scene that contains camera parameters (e.g. focal length, scan rate and orientation) and thus a mathematical description of distortions caused by the CORONA camera. Once panoramic sensor model equations are defined, the model parameters are estimated with the help of GCPs in a least square process. After these parameters are estimated, they can be used to map ground points (latitude, longitude, and height) to a particular pixel in the image (Figure 9). However, no commercial GIS is able to make direct use of these parameters and display the image correctly. We therefore follow a procedure used by high-resolution satellite vendors to map these unusable parameters (model parameters of GeoEye images, for example, are proprietary) to a well-known set of general parameters known as Rational Polynomial Coefficients, or RPCs. Since all commercial satellite vendors use the same set of RPCs, virtually all GIS software with basic image processing capabilities can project the RPC-enabled CORONA images to a ground plane or DEM. This process, called orthorectification, is the next step in the process.
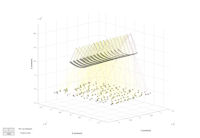
Figure 9: Bundle-adjusted CORONA block, illustrating position of images in space and re-projection onto a plane
The final stage of our correction process corrects for errors due to topographic relief, a process termed orthorectification. Once an image is orthorectified, relief displacement of the terrain is removed, and geographical features appear in their true locations. We orthorectify CORONA images by projecting them over a digital elevation model, generally the SRTM Level 1 DEM with a nominal ground resolution of 90 metres. The digital elevation model is equally sampled for ground coordinates and for their elevation values, such that the accuracy of the base digital elevation model is of immense importance for the overall process. Studies show that while higher resolution DEMs may be available, the SRTM provides very high accuracy (Rodriguez et al. 2006). When further correction is required, an extra set of points, collected at strategic locations such as ridges and stream channels, or any other feature with geomorphic significance, can be added to the orthorectification process. Our analysis shows that the accuracy of most of our orthorectified images range from 3–10 metres at nadir to 20–80 metres at the edges (Cothren et al. in press; Figure 10). The low accuracy at the edges of terrain-corrected images is due to the panoramic scan of the CORONA sensors, where the rigorous sensor model behaves rather poorly in these portions of the image. Occasionally, individual images or an entire block of images (those derived from a single camera during the same satellite revolution) produce less than optimal results or fail completely. We are continuing to evaluate the reasons for such failures, but they are most likely the result of image distortions that are unknown to us, derived for example from how the images were scanned, stretching or deformation in the physical film strips, or similar issues.
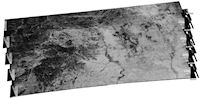
Figure 10: Orthorectified block of CORONA images
CORONA images in the online Atlas are stored in National Imagery Transmission Format (NITF), an imagery standard developed by the US Department of Defense that allows us to embed the original image, RPCs and other data used to correct the imagery geometrically, along with other metadata in a form that is recognised by most GIS software. These NITF images then are orthorectified 'on-the-fly', being projected over an SRTM digital elevation model as the user pans through the data, rather being served as static, ortho-images. We chose this on-the-fly method, currently handled by ArcGIS Image Server, for several reasons. First, orthorectifying all 1200+ images in the Atlas is a time-consuming process that, once completed, removes most opportunities for accuracy enhancement by the inclusion of better ground control points or higher accuracy DEMs. Second, because most CORONA orbits had significant inclinations, the scan direction is rotated by several degrees from north. The orthorectified image must be rectangular and the 'dead-space' can cause the size of a single CORONA scene to increase from 1GB to as much as 4GB. While compression techniques can reduce the file size, image display and processing speed can suffer, while downloading images would become problematic for many users.
A user who wishes to download and display a fully orthorectified image in GIS software can download the approximately 1GB NITF CORONA image along with the underlying SRTM DEM. Following simple procedures outlined in the Help menu, users can then link the image and DEM in GIS software packages, producing the same ortho-image viewed in the online Atlas. While this complicates the task of properly displaying a downloaded image, the flexibility it provides is worth the effort. Users who require higher accuracy can input a few high-quality ground control points or project the image onto a higher resolution DEM, either of which will improve the accuracy orthorectification. The NITF format also preserves the capability of CORONA images to be used for DEM extraction and other photogrammetic processes (see CORONA in 3D). For users wishing to download only a small portion of the orthorectified CORONA scene, the Atlas provides a snapshot tool that saves the current view in orthorectified form as a PNG file. These small clipped images can then be easily incorporated into presentations, publications, or other uses with little effort.
© Internet Archaeology/Author(s)
University of York legal statements | Terms and Conditions
| File last updated: Fri Sept 21 2012