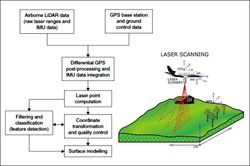
Figure 1: Chart illustrating process of LIDAR data capture and processing (after Devereux and Amable 2009, 60; Renslow et al. 2000, 4)
Airborne Laser Scanning (ALS) LIDAR systems contain a ranging laser system (typically a pulse laser system), a Position and Orientation System (POS)comprising a Differential Global Positioning System (DGPS), Inertial Measurement Unit (IMU) and a control unit (Wehr and Lohr 1999, 69). Using these three systems, the x, y, and z point for any position on the Earth's surface can be found. The IMU measures the yaw, pitch and roll of the aircraft to allow for the angular orientation of the pulse to be known, the GPS is used to calculate position and a laser range finder to emit and calculate the time taken for each laser pulse to reflect off the ground (or other surface) and return to the sensor. The laser pulse ranging systems currently available can measure between 5 and 200,000 points per second, although typically at 100,000 to 150,000 points per second (Heritage and Large 2009, 2-4; Otiz 2013, 17). The resulting dataset, known as a 'point cloud', is subsequently processed, illustrated by Figure 1, and used to produce surface models known as Digital Elevation Models (DEM).
Figure 1: Chart illustrating process of LIDAR data capture and processing (after Devereux and Amable 2009, 60; Renslow et al. 2000, 4)
Archaeologically, the most common products of airborne LIDAR survey utilise the first and last return, which refers to the first pulse and last returned laser pulses. These are typically used to calculate a Digital Surface Model (DSM) and Digital Terrain Model (DTM) (Doneus et al. 2007, 278). A DSM is calculated from the first return and records the highest points in the survey area, including features such as buildings and vegetation. A DTM uses an algorithm to filter features from the last return that are above the natural ground surface, and as a result has proved particularly useful in revealing features hidden by vegetation (Crutchley and Crow 2009, 41). An example of a commonly derived visualisation from DTM and DSM data is known as 'hillshade' and allows rapid visualisation of the data by depicting the terrain in shaded relief, illuminating the area with a hypothetical light source (Figure 2).
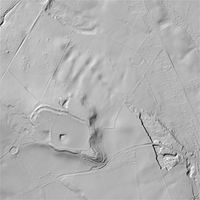
Figure 2: 'Hillshade' (angle: 45° azimuth: 315°) of Eddisbury hillfort, Cheshire (data courtesy of Cheshire West and Chester Council)
Internet Archaeology is an open access journal based in the Department of Archaeology, University of York. Except where otherwise noted, content from this work may be used under the terms of the Creative Commons Attribution 3.0 (CC BY) Unported licence, which permits unrestricted use, distribution, and reproduction in any medium, provided that attribution to the author(s), the title of the work, the Internet Archaeology journal and the relevant URL/DOI are given.
Terms and Conditions | Legal Statements | Privacy Policy | Cookies Policy | Citing Internet Archaeology
Internet Archaeology content is preserved for the long term with the Archaeology Data Service (ROR). Help sustain and support open access publication by donating to our Open Access Archaeology Fund.
File last updated: Wed Oct 23 2013