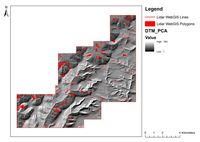
Figure 17: Overview of features identified during WebGIS transcription.
Six volunteers identified 263 features in the study area (Figure 17).
Figure 17: Overview of features identified during WebGIS transcription.
Feature transcription rate was 16.43 features per hour, based on approximately four 2-hour sessions per user, focused on a 5km² grid. Comparison with professional transcription rates is problematic owing to the lack of directly analogous data, as professional projects are frequently required to cross-reference with more datasets than LIDAR visualisations and historical/modern cartography alone. However, a closely comparable method, 'Revised Level 2', conducted adjacent to the project area by the Forest of Dean Archaeological Survey and described as a 'rapid assessment', returned a transcription rate that averaged 4.7km² per day, which is similar to the 5km² covered per 8 hours by the volunteers used by the project (Hoyle 2008, 28). This indicates a similar transcription speed although, importantly, it does this not indicate parity in transcription quality.
There is a high proportion of potentially medieval period feature types evident in the data. This is unsurprising, given 72% of the archaeological features transcribed from aerial photographs during the Cotswolds Hills NMP project, which partially covers the study area, were medieval and/or post-medieval in origin (Janik et al. 2011, 55). The most common feature type identified was ridge and furrow. This is possibly due to the very distinctive nature of this feature type when viewed from the air and the strong likelihood that participants with an interest in British archaeology are going to be familiar with this type of earthwork. Some areas of ridge and furrow were not recorded on the HER records for the area (Figure 18).
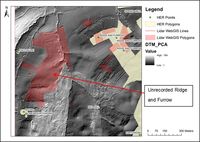
Figure 18: Area of previously unrecorded ridge and furrow.
Extensive ridge and furrow and earthworks are present in several areas of England, including Gloucestershire, and as such dominate large swathes of the countryside and this is represented to a degree in historic environment records (Rackham 1995, 169; Janik et al. 2011, 11). However, from airborne survey it is evident that many forms of earthworks such as ridge and furrow are a dwindling resource (Palmer 1996, 439). Consequently, as demonstrated here, areas that remain unrecorded require adequate investigation to ensure valuable information is not lost.
Unless depicted on 1st edition OS mapping, users identified few quarry sites and on reflection this feature type appears to be under-represented in the data. This may be due to the difficulty of distinguishing them from natural rock outcrops without desk-based research, the small scale of quarrying in the region, or prior experience with that particular feature type.
Apart from parcels of ridge and furrow earthworks, no significant new features were evident when comparing the volunteered project data to HER records for the area. This is potentially an area-specific phenomenon and may vary from county to county according to the range of data used by the individual HER and the variability of knowledge or skill of the volunteers involved. In this case, the GCC have been involved in a number of pioneering LIDAR projects relating to the Forest of Dean and as such have an excellent level of experience of transcribing and interpreting LIDAR data (Hoyle 2008). An additional reason for the paucity of new sites is that the dataset has been used in a variety of projects previously, the results of which have been integrated in the local HER. As a result, the potential for new discoveries is limited.
Figure 19 indicates that the bulk of the features identified were visible on the majority of LIDAR visualisation methods; this may not, however, indicate parity in the effectiveness of the methods but a tendency by the user to identify the more obvious features, which are more likely to be visible across a wide array of visualisation techniques. The visibility of features is significantly lower using vertical aerial imagery provided by Google. This is unsurprising given the ability of LIDAR to remove vegetation and render the relative height of the landscape using a colour palette, unlike vertical imagery. However, the figures highlight the benefit of prospection using a combination of LIDAR and aerial photographic data rather than one data source in isolation.
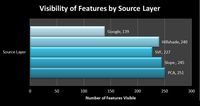
Figure 19: Graph illustrating visibility of features by source layer
The tendency to recognise more distinctive features is evident in the overall number of features identified when compared to HER records for the area. More insubstantial or difficult to interpret features are sometimes omitted from the transcription. Based upon the results, the slight linear earthwork features shown by Figure 20 illustrate a typical example of feature types that often appear to be overlooked by a non-expert, or mistaken for modern tracks or paths during the project.
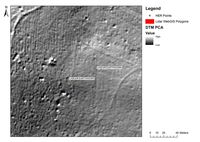
Figure 20: Example of linear earthwork features, possibly forming an enclosure, shown as HER points and visible in LIDAR visualisations but not transcribed by users of WebGIS
Considering semantic and attribute accuracy, it is noticeable that broad descriptive terminology was often attributed to the identified features, e.g. 'Large enclosure with bank and ditch' being used to designate a site rather than 'hillfort'. The tendency to use broader terminology is arguably a reasonable expectation, given a non-expert may not have developed as comprehensive a vocabulary or possess detailed local knowledge. However, attribute terms are broadly accurate and, given the significant latitude afforded to the user, acceptable. Semantic accuracy, in this case defined as user annotation/descriptions added to the 'Description' field, are difficult to assess. The difficulty of assessing the merit of such descriptions is common in many volunteer geographic information projects (Arago et al. 2011, 4). However, core to the aims and objectives is the ability of the project to produce alternative maps, incorporating multiple interpretations and consequently codification or standardisation is kept to a minimum to ensure freedom of expression is maintained. Consequently, the variability in terminology and depth of user input is simultaneously a limitation (when intending to incorporate findings with traditional databases such a HER) and a benefit (when using the data as a standalone output to offer contrast to official interpretations and recording methods).
The results represent not only what is visible and recognisable in the data to participating non-professional archaeologists and enthusiasts but suggests what landscape elements beyond monuments and historic buildings are valued as contributing to the historic environment of the area as a result of the data being transcribed from the DTM, which largely removes extant buildings. Values assigned to features tend to be low, with a mean value of 1.41. There are notable outlier features with a high assigned value when known to the user as substantial archaeological sites, such as hillforts. One potential contributing factor to this observed low mean value is the high occurrence of low-level earthworks identified, such as ridge and furrow, leading to the impression of a feature type that is fairly ubiquitous in the area and therefore of low significance.
A sample of the features identified during the project was selected for subsequent ground truthing using an iPad tablet, based upon a 2x2km grid square, directly west of the village of Sheepscombe (NGR: SO89121043) (Figure 21). The tablet has a built-in GPS that enabled sites to be located successfully (Figure 22).
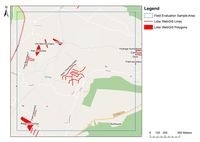
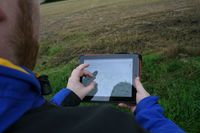
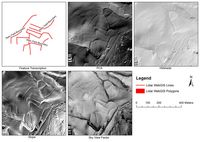
Figure 21: Map depicting area selected for ground truthing.
Figure 22:Utilising the WebGIS application on an Apple iPad in the field.
Figure 23: LIDAR visualisations of features depicted in Figures 24-26
GPS positional accuracy on the iPad is at best ±10m but allowed for navigation between features with little difficulty. All accessible features in the area were extant, although because of the season vegetation was high and features were obscured in places, leading to some difficulty in photographing features adequately. Feature descriptions, although lacking detail at times, were morphologically accurate and satisfactorily interpreted the feature, bearing in mind the typical archaeological and local knowledge-base of the user (Figures 23-34).
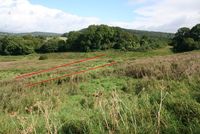
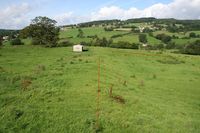
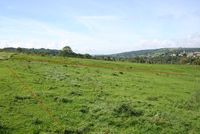
Figure 24: North-facing photograph of two possible relict field boundaries (Line Feature ID: 58)
Figure 25: North-west facing photograph, Line Feature ID: 60 and 57, depicting two possible relict field boundaries
Figure 26: West-facing photograph of Line Feature ID: 1 and 55, depicting two possible relict field boundaries
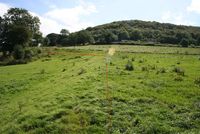
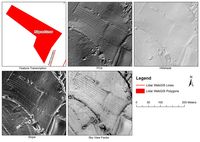
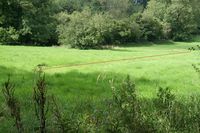
Figure 27: South-facing photograph of Line Feature ID: 60 and 59, possible part of a relict field system
Figure 28: LIDAR visualisations of Polygon Feature ID: 135
Figure 29: Photograph of slight ridge and furrow earthworks taken facing west. (Polygon Feature ID: 135)
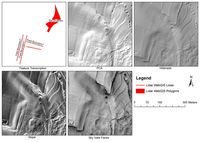
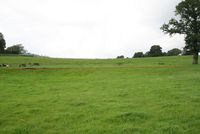
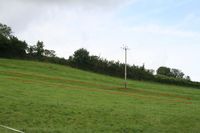
Figure 30: LIDAR visualisations of features illustrated by Figures 31 and 32
Figure 31: Photograph of a 'possible old-field boundary', taken facing north-east (Line Feature ID: 7)
Figure 32: Photograph of a 'Pair of ditches', taken facing north-west (Polygon Feature ID: 6)
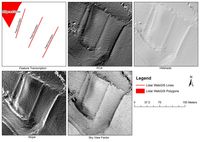
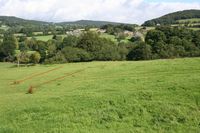
Figure 33: LIDAR visualisations of Line Feature ID 100 and 101, shown in Figure 34
Figure 34: Two slight banks of earth may be part of relict field system or ridge and furrow (Line Feature ID 100 and 101)
Internet Archaeology is an open access journal based in the Department of Archaeology, University of York. Except where otherwise noted, content from this work may be used under the terms of the Creative Commons Attribution 3.0 (CC BY) Unported licence, which permits unrestricted use, distribution, and reproduction in any medium, provided that attribution to the author(s), the title of the work, the Internet Archaeology journal and the relevant URL/DOI are given.
Terms and Conditions | Legal Statements | Privacy Policy | Cookies Policy | Citing Internet Archaeology
Internet Archaeology content is preserved for the long term with the Archaeology Data Service (ROR). Help sustain and support open access publication by donating to our Open Access Archaeology Fund.
File last updated: Wed Oct 23 2013