The datasets were first imported into Global Mapper 12.02, used to mosaic tiles together and produce maps in ArcGIS compatible formats (.geotiff for raster data and ESRI shapefiles for vector). ArcGIS 10.2.1 was then used to display and manipulate these files. First, all data were projected onto a standard WGS 84 basemap, and the 'Set Null' tool was used on the raster datasets to ensure that points on rivers or lakes, which ArcGIS arbitrarily sets to an extreme value like -32767, were instead properly treated as null.
The ArcGIS 'Slope' tool was applied to the topographic SRTM4.1 data to generate a slope map, and then the new map was subjected to the same process to generate a map of the variability in slopes, or terrain roughness. Appropriate Z values for using the slope tool were obtained from the ArcGIS online resources. These values are latitude-specific, and values were chosen to match the approximate mid-point of the maps. Each dataset was then adjusted to display its patterning clearly, with raster datasets shaded using parts of the colour spectrum, and soil, surface geology, ecoregions and vegetation coloured by category (see Table 1). Prior to display, the vegetation map was adjusted using the 'Merge' tool to convert the original ~20 categories into just six (open, semi-open, closed, aquatic, anthropogenic and arid/semi-arid vegetation). Adobe Illustrator 5.5, with MAPublisher 9.4, was used to add labels.
The analyses presented here are qualitative because I emphasise environmental patterns rather than the precise relationships between different variables. Quantitative analyses were not used for two reasons: firstly, it is hard to analyse categorical and continuous variables at the same time and the sheer size of the datasets made the use of multivariate methods that could do this (as trialled, for example, in Winder in press) impossible without a supercomputer. Secondly, analyses of spatial autocorrelation (which would, in any case, only work for the continuous data) are likely to be notably scale- and location-dependent, and therefore less useful for this article's purpose of exploring potential persistent landscape patterns.
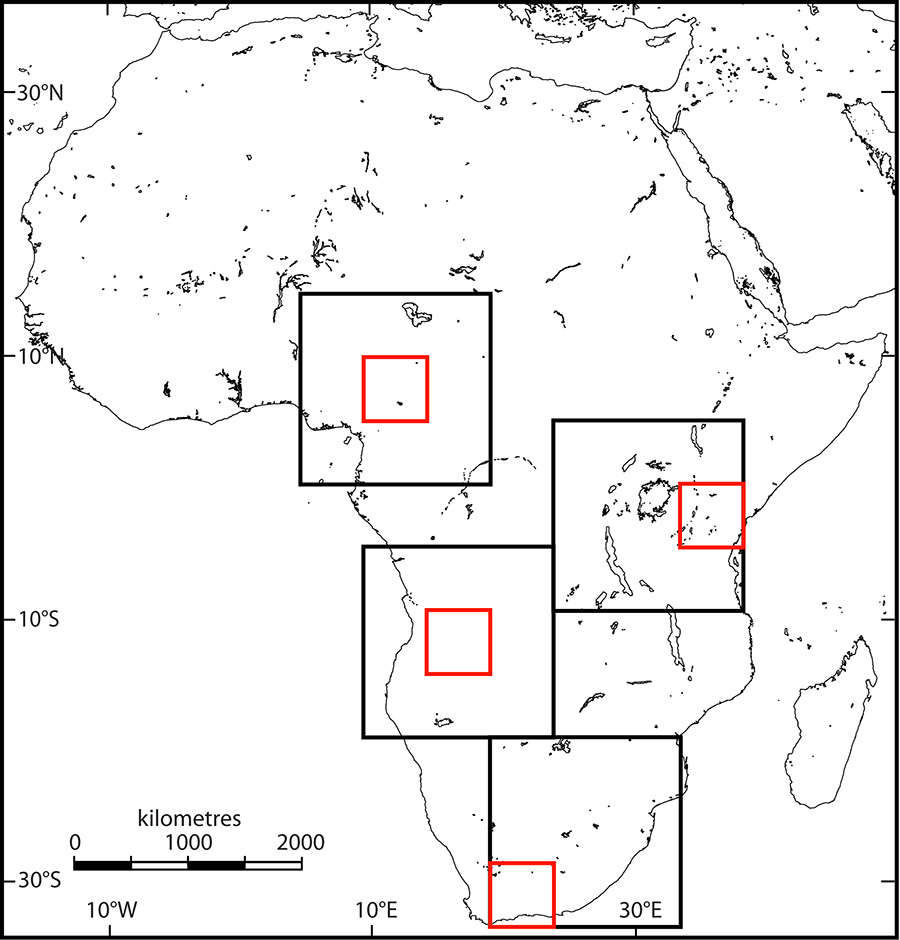
The datasets described in Table 1 are all either global or continental. For smaller-scale analyses, they therefore needed to be cut down. To keep things simple and minimise the biases associated with attempts to define regions or local areas from pre-existing knowledge of the precise locations of hominin sites, regional analyses focused on 15x15 degree tiles and small-scale 'local' analyses on 5x5 degree tiles, the locations of which are shown in Figure 1. The regional tiles covered east Africa at 10°S-5°N and 25-40°E (an area centred roughly on Lake Victoria), south Africa at 20-35°S and 20-35°E (with the cradle of humankind roughly central), central Africa at 20-5°S and 10-25°E and west Africa at 15°-0°N and 5-20°E (an area centred on the Cameroon ridge) (Figure 2). Local areas were defined within these blocks, at 35-40°E and 5°S-0°N (east Africa), 30-35°S and 20-25°E (south Africa), 10-15°S and 15-20°E (central Africa) and 5-10°N and 10-15°E (west Africa). The ArcGIS 'Clip' tool was used to cut out these sections of the large-scale maps, and they were subject to the same procedures as the continental ones. The soil maps were omitted at the smallest scales, because their low resolution meant that little interpretation was possible.
Internet Archaeology is an open access journal based in the Department of Archaeology, University of York. Except where otherwise noted, content from this work may be used under the terms of the Creative Commons Attribution 3.0 (CC BY) Unported licence, which permits unrestricted use, distribution, and reproduction in any medium, provided that attribution to the author(s), the title of the work, the Internet Archaeology journal and the relevant URL/DOI are given.
Terms and Conditions | Legal Statements | Privacy Policy | Cookies Policy | Citing Internet Archaeology
Internet Archaeology content is preserved for the long term with the Archaeology Data Service (ROR). Help sustain and support open access publication by donating to our Open Access Archaeology Fund.
File last updated: Wed Mar 4 2015